Review of Recent Economic and Financial Developments Presentation
Afolabi E. Olowookere, Ph.D., presented a comprehensive review of recent economic and financial developments at the 3rd Capital Market Committee Meeting in Lagos. The presentation outlined global economic trends, oil price impacts, production outputs, growth indicators, stock market performance, fiscal positions, external trade influences, and future considerations. Key points highlighted the sluggish global economic growth, uncertainties post-Brexit, US Presidential election effects, and challenges faced by Nigeria due to foreign currency shortages and low investor confidence.
Download Presentation

Please find below an Image/Link to download the presentation.
The content on the website is provided AS IS for your information and personal use only. It may not be sold, licensed, or shared on other websites without obtaining consent from the author. Download presentation by click this link. If you encounter any issues during the download, it is possible that the publisher has removed the file from their server.
E N D
Presentation Transcript
Review of Recent Economic and Financial Developments Afolabi E. Olowookere, Ph.D. Presented at the 3rd Capital Market Committee Meeting, Federal Palace Hotel, Lagos on 24th November, 2016
Outline of Presentation Outline of Presentation Global Economy Oil Price and Production Output and Growth Prices and Employment Money Market Stock Market Fiscal Position External Trade and Finance Determining Factors Going Forward
The Global Economy The Global Economy Global economic growth has been sluggish but steady. The IMF (Oct. 2016) reviewed global growth downwards by 0.1% due to Low growth outlook for advanced economies following Brexit Weak growth in the US US Presidential election future uncertain Mr. Trump s pledge to move the economy sent the US stock market up Trade restrictions could damage the economy Trigger the rise of nationalism Oil? In UK, the full impact of Brexit is still uncertain It is still not clear whether UK will leave the European single market or negotiate associate membership Awaiting Supreme Court judgment on the role of Parliament in the negotiation
The Global Economy (IMF, WEO The Global Economy (IMF, WEO- -Oct Oct.) .) Region/Country 2014 2015 2016 2017 US rates will likely be increased in December - expected due to improved growth prospects. China growth relatively stable due to policies implemented to support growth Brazil still in recession but with expectations of less economic, political and policy uncertainty India continues a strong recovery largely due to effective policy actions Lower growth for SSA due to the sharp slowdown in some of the largest economies in the region In Nigeria, the challenges remain: foreign currency shortages due to lower oil receipts, low power generation weak investor confidence World Advanced Economies Euro Area EMs and Developing Sub-Saharan Africa 3.40 1.90 0.90 4.60 5.10 3.20 2.10 2.00 4.00 3.40 3.10 1.60 1.70 4.20 1.40 3.40 1.80 1.50 4.60 2.90 United States United Kingdom 2.40 3.10 2.60 2.20 1.60 1.80 2.20 1.10 China India Brazil South Africa 7.30 7.20 0.10 1.60 6.90 7.60 -3.80 1.30 6.60 7.60 -3.30 0.10 6.20 7.60 0.50 0.08 0.60 Nigeria 6.30 2.70 -1.70
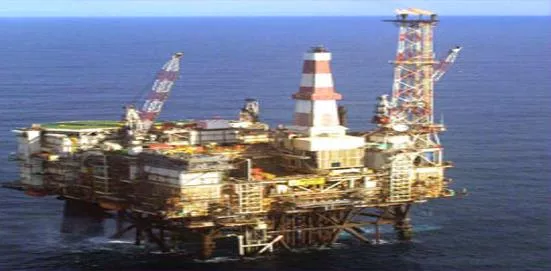
Oil Price and Production Oil Price and Production Price of Bonny Light averaged $50.83 in Oct. 2016 An increase of 67.2% this year Average price still gives room to support budget ($38pb) But for lowered production Weak global demand and excess supply have dampened growth Nigeria production averaged 1,628bpd in October, 2016 (OPEC) 11.9% lower than 1,848bpd in January 2016 Other sources put production as lower Lower production due to pipeline vandalism and lack of new investment in sector Nigeria exiting JV cash call arrangement likely to be beneficial Nigeria exempted from production cuts agreed by OPEC But, there is still uncertainty about the possibility of the OPEC production cut working Trend of Bonny Light Price 140 120 100 80 60 40 20 0 Jan-10 Jan-11 Jan-12 Jan-13 Jan-14 Jan-15 Jan-16 Jul-10 Jul-11 Jul-12 Jul-13 Jul-14 Jul-15 Jul-16 Oct-10 Oct-11 Oct-12 Oct-13 Oct-14 Oct-15 Oct-16 Apr-10 Apr-11 Apr-12 Apr-13 Apr-14 Apr-15 Apr-16 Nigeria Oil Production 2,500 2,000 1,500 1,000 500 0 May-10 May-11 May-12 May-13 May-14 May-15 May-16 Jan-10 Jan-11 Jan-12 Jan-13 Jan-14 Jan-15 Jan-16 Sep-10 Sep-11 Sep-12 Sep-13 Sep-14 Sep-15 Sep-16
Output and Growth Output and Growth Nigeria moved into a deeper recession with growth in Q3 16 at -2.24 The industrial sector contracted the most (-12.21%) Largely due to contraction in Crude Petroleum and Natural Gas sub- sector (-22.01%) Cement (-6.26%), Food, Beverage and Tobacco (-5.75%) and many other manufacturing activities also contributed The service sector, which is contributes 50.24% of the country s GDP, also contracted by -1.17%. Agriculture sector however grew by 4.54% Only the Fishing contracted by -5.59% Back to the farms! 2015 2016 Sector Growth rates (%) Q1 Q2 Q3 Q4 Total Q1 Q2 Q3 Agriculture 4.7 3.49 3.46 3.48 3.72 3.09 4.53 4.54 Industry -2.53 -3.31 -0.13 -3.04 -2.24 -5.49 -9.53 -12.2 Services 7.04 4.67 3.97 3.69 4.78 0.8 -1.25 -1.17 Real Growth Rate 3.96 2.35 2.84 2.11 2.79 -0.36 -2.06 -2.24 Real Non-Oil Growth Rate 5.59 3.46 3.05 3.14 3.75 -0.18 -0.38 0.03 component
Prices and Employment Prices and Employment Inflation Nigeria inflation increased to 18.3% in October, recording the 9th consecutive month of rise in prices Increases were recorded in most of the key divisions that make up the CPI Major increase recorded in the food and core sub-indices High energy prices and imported inflation The rise highlights the macroeconomic uncertainty and high cost of living in the country 18.3 17.6 16.5 17.9 17.1 13.7 11.4 9.6 9.3 9.3 9.2 8.7 8.4 9.6 9.4 9.4 9.2 15.6 9 8.5 8.2 12.8 Dec-15 Feb-15 Sep-15 Feb-16 Sep-16 Jan-15 Aug-15 Jan-16 Aug-16 Jun-15 Jun-16 Jul-15 Jul-16 Nov-15 Apr-15 Apr-16 Mar-15 May-15 Oct-15 Mar-16 May-16 Oct-16 19.3 19.1 18.7 17.4 15.4 18.3 17.5 17.7 16.6 17.9 Unemployment, underemployment have also risen to 13.3% and 19.3% respectively. Thus, proportion of Nigeria s labour force working for less than 20hrs a week is 32.6% 13.3 12.1 10.4 9.9 9.7 8.2 7.8 7.5 7.4 6.4 2014:Q1 2014:Q2 2014:Q3 2014:Q4 2015:Q1 2015:Q2 2015:Q3 2015:Q4 2016:Q1 2016:Q2 Unemployment (%) Underemployment (%)
Money Market Money Market Short-term interest rates are on the rise Average OBB rate rose from 2.1% in January to 30.0% in October During the same period, O/N rate rose from 2.6% to 31.3%. Implications: o High cost of borrowing (govt. and private) o High returns on financial investment o Preference for fixed income instrument o But with high inflation, real return low Monthly Average rates- FMDQ 35.0 31.3 30.0 30.0 25.0 20.8 19.3 20.0 17.0 15.5 13.8 15.0 12.6 12.3 11.5 10.0 6.9 6.5 6.4 MPC maintained the existing monetary policy, leaving the MPR rate at 14% implying: Preference for price stability over growth Trade-off between domestic and foreign investment Need for complementary fiscal policy 6.0 4.9 4.4 5.0 2.7 2.6 2.3 2.1 0.0 Jan Feb Mar Apr May Jun Jul Aug Sep Oct OBB(%) O/N(%)
Stock Market Stock Market The All-Share Index stood at 27,220.09 points at the end of October 2016 Fell from 28,335.40 recorded in September. Gained 18.48% from January Lost 6.71% compared to October 2015 Market capitalization for the same period was N9.4trn ASI closed at 25,517 yesterday Market Cap of N8.8tn Q3 corporate earnings was insipid Challenging economic environment Investors negative sentiment Low foreign inflow Introduction of Infrastructure Bonds can also deepen market NSIA, Infracredit, Guarantco, PENCOM, SEC 11,740 33,920 11,240 31,920 10,740 Billion Naira 29,920 10,240 Points 9,740 27,920 9,240 25,920 8,740 23,920 8,240 Market Capitalization(N'bn) All-Share Index
Fiscal Position Fiscal Position FAAC ALLOCATION (N B) FACC in October fell to N455bn; N559bn was attained in June Vandalism and maintenance costs Oil price fluctuations Low economic activities Low FACC contributes to States Inability to pay salaries Reduced purchasing power Federal Government retained revenue in Q3 16 was N934.5 billion So far 25.7% negative variance this year Expenditure was N1,235.5 billion 19.6% positive variance this year Estimated deficit of N1,090.96 billion 98.8% higher than the budgeted for 9 months 559.0 516.0 510.2 459.7 455.0 443.6 407.5 360.4 360.0 336.2 305.1 297.8 280.9 DEC-15 MAR-16 MAY-16 OCT-15 APR-16 AUG-16 OCT-16 JAN-16 FEB-16 NOV-15 JUN-16 SEP-16 JUL-16 Q1-15 1,027.0 1,156.6 -129.5 Q2-15 538.6 1,024.5 -485.9 Q3-15 1,044.8 1,190.3 -145.5 Q4-15 808.5 1,544.3 -735.8 Q1-16 505.1 1,230.3 -725.2 Q2-16 677.9 1,136 .9 -659.1 Q3-16 934.52 1,235.5 -301.0 Retained Revenue (N b) Expenditure (N b) Overall Balance (N b)
External Trade and Finance External Trade and Finance Nigeria s current account has been in the negative since Q4 2015 Stood at N141.7bn in Q1 16 EIU is projecting current account deficit of N1,576bn and N1,607bn for 2016 and 2017 respectively Nigeria s external reserve as at the end of October stood at $23.95bn. Lost 14.9% from January 2016 and 20.5% from October 2015 Dwindling reserves attributed to Nigeria s inability to meet its crude oil production target There is about 54% premium between the official (305/$) and parallel (470/$) exchange rates Market segmentation caused by: Demand higher than supply Delayed policy response Speculation and uncertainty Efforts to equalise rates Increased weekly supply to BDCs from $30,000 to $50,000 $7.9bn intervention at the interbank foreign exchange market Road shows to attract foreign investor Maintaining MPR at 14% Investor are cautious CBN independence Policy inconsistency Foreign exchange risk Poor domestic investment climate EXTERNAL RESERVES ($'BN) 34.3 31.5 31.4 31.3 30.3 30.2 29.9 29.8 29.6 29.5 29.1 28.2 27.9 27.8 26.21 27.1 29 26.4 26.4 25.4 24.5 24 MAY-15 JUN-15 SEP-15 MAY-16 JUN-16 SEP-16 FEB-15 APR-15 AUG-15 OCT-15 NOV-15 DEC-15 FEB-16 APR-16 AUG-16 OCT-16 JAN-15 MAR-15 JAN-16 MAR-16 JUL-15 JUL-16 EXCHANGE RATE (N/USD) 600 500 400 300 200 100 0 Dec-15 Mar-15 Apr-15 May-15 Aug-15 Mar-16 Apr-16 May-16 Aug-16 Jun-15 Oct-15 Jun-16 Oct-16 Jan-15 Nov-15 Jan-16 Feb-15 Jul-15 Sep-15 Feb-16 Jul-16 Sep-16 Official Parallel
Determining Factors Going Forward Determining Factors Going Forward Militancy and insurgency Corruption fight Fiscal stance of States Competitiveness Investments (Domestic and Foreign) Infrastructure Elections e.g. Edo, Ondo Oil price Tax base and rates Infrastructure Public Debt Interest rate Exchange rate
Thank you Thank you


