Regression Models - Linear & Nonlinear: Chao Xu, PhD
R Short Course Part 2
Topic1: Regression models
including linear regression and
nonlinear model
Chao Xu, PhD
Department of Biostatistics and Epidemiology
Hudson College of Public Health, OUHSC
February 28, 2025
Outline
•
Prerequisites
–
Basic R programming
–
Regression model
•
Linear regression
•
Nonlinear regression
2
Linear Regression
3
Linear Regression
4
Linear Regression
•
Example – FEV and Height
–
Forced expiratory volume (FEV): an index of
pulmonary function that measures the volume of
air expelled after 1 second of constant effort
5
Linear Regression
•
Data
6
Linear Regression
•
Data
7
Linear Regression
•
lm()
> fit.lm=lm(dr$FEV~dr$Height)
> fit.lm
Call:
lm(formula = FEV ~ Height, data = dr)
Coefficients:
(Intercept) Height
-5.3432 0.1304
8
Linear Regression
•
lm()
> fit.lm=lm(FEV~Height,data=dr)
> fit.lm
Call:
lm(formula = FEV ~ Height, data = dr)
Coefficients:
(Intercept) Height
-5.3432 0.1304
9
Linear Regression
•
Extract estimates
10
Linear Regression
•
Extract CI: confint()
11
Linear Regression
12
Linear Regression
13
Linear Regression
14
Linear Regression
•
Subset: male subjects
15
Linear Regression
•
Subset: age<7
16
Linear Regression
17
Linear Regression
•
Model diagnostic
–
Box-Cox Transformations For Linear Models
–
library(car)
18
Linear Regression
19
Linear Regression
•
Model diagnostic:
plot(fit.lm)
–
homogeneity of variance: the variance of the
dependent variable are the same for different
subpopulation
20
Linear Regression
•
Model diagnostic
–
homogeneity of variance: the variance of the
dependent variable are the same for different
subpopulation
–
Score Test For Non-Constant Error Variance
21
Linear Regression
•
Model diagnostic:
–
the means of the subpopulation of dependent
values lies on a straight line
library(car)
crPlots(fit.lm)
22
Linear Regression
•
Model diagnostic:
–
the dependent values are independent of each other
–
Durbin-Watson Test computes residual autocorrelations
and generalized Durbin-Watson statistics and their
bootstrapped p-values
23
Linear Regression
•
Influential points
–
Cook’s distance
24
Linear Regression
•
Multivariate model
–
Univariate analysis
25
Linear Regression
•
Multivariate model
26
Linear Regression
•
Multivariate model
27
Linear Regression
•
Variable/feature selection
–
Forward/Backward/Stepwise regression analysis
–
step(): AIC or BIC
28
Linear Regression
•
Variable/feature selection
–
Forward/Backward/Stepwise regression analysis
–
step(): AIC or BIC
29
Nonlinear regression
•
Infant Mortality Rate vs Gross Domestic
Product
–
Quadratic model
–
LOESS: LOcal regrESSion
30
https://databank.worldbank.org/reports.aspx?source=2&series=SP
.DYN.IMRT.IN&country
=
Nonlinear regression
•
IMR vs GDP
–
World Bank data of 2018, n = 187 countries
31
Nonlinear regression
•
IMR vs GDP
32
Nonlinear regression
•
Quadratic model
33
Nonlinear regression
•
Quadratic model
34
Nonlinear regression
•
Quadratic model
35
Nonlinear regression
•
Quadratic model
36
Nonlinear regression
•
loess()
37
Nonlinear regression
•
loess()
38
Nonlinear regression
•
loess()
39
Delve into regression models, including linear and nonlinear types, presented by Chao Xu, PhD from the Department of Biostatistics and Epidemiology at Hudson College of Public Health. Explore topics such as basic R programming, prerequisites, continuous outcomes, command lm(), FEV and Height examples, data interpretation, coefficients, confidence intervals, p-values, and more.

Uploaded on Feb 28, 2025 | 0 Views
Download Presentation

Please find below an Image/Link to download the presentation.
The content on the website is provided AS IS for your information and personal use only. It may not be sold, licensed, or shared on other websites without obtaining consent from the author.If you encounter any issues during the download, it is possible that the publisher has removed the file from their server.
You are allowed to download the files provided on this website for personal or commercial use, subject to the condition that they are used lawfully. All files are the property of their respective owners.
The content on the website is provided AS IS for your information and personal use only. It may not be sold, licensed, or shared on other websites without obtaining consent from the author.
E N D
Presentation Transcript
R Short Course Part 2 Topic1: Regression models including linear regression and nonlinear model Chao Xu, PhD Department of Biostatistics and Epidemiology Hudson College of Public Health, OUHSC February 28, 2025
Outline Prerequisites Basic R programming Regression model Linear regression Nonlinear regression 2
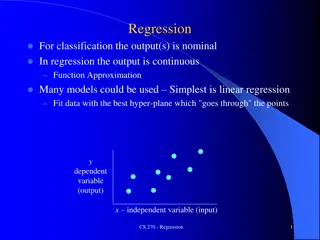
Linear Regression Continuous outcome ? = ?0+ ?? + ? ?~?(0,?2) ?|?~?(?0+ ??,?2) Variable of interest ?0, ?, confidence intervals (CI), and p-value Fit statistics: ?2 3
Linear Regression Mostly used command lm() ??(???????~??????????,[ ]) [ ]: optional arguments data = your.data subset = gender== Female Other advanced functions 4
Linear Regression Example FEV and Height Forced expiratory volume (FEV): an index of pulmonary function that measures the volume of air expelled after 1 second of constant effort 5
Linear Regression Data 6
Linear Regression Data 7
Linear Regression lm() > fit.lm=lm(dr$FEV~dr$Height) > fit.lm Call: lm(formula = FEV ~ Height, data = dr) Coefficients: (Intercept) Height -5.3432 0.1304 8
Linear Regression lm() > fit.lm=lm(FEV~Height,data=dr) > fit.lm Call: lm(formula = FEV ~ Height, data = dr) Coefficients: (Intercept) Height -5.3432 0.1304 9
Linear Regression Extract estimates 10
Linear Regression Extract CI: confint() 11
Linear Regression P-values and ?2 12
Linear Regression P-values and ?2 13
Linear Regression P-values and ?2 14
Linear Regression Subset: male subjects 15
Linear Regression Subset: age<7 16
Linear Regression Model diagnostic: plot(fit.lm) ?~? 0,?2,?|?~?(?0+ ??,?2) 17
Linear Regression Model diagnostic Box-Cox Transformations For Linear Models library(car) 18
Linear Regression Model diagnostic Box-Cox Transformations For Linear Models ? =?? 1 ? 19
Linear Regression Model diagnostic: plot(fit.lm) homogeneity of variance: the variance of the dependent variable are the same for different subpopulation 20
Linear Regression Model diagnostic homogeneity of variance: the variance of the dependent variable are the same for different subpopulation Score Test For Non-Constant Error Variance 21
Linear Regression Model diagnostic: the means of the subpopulation of dependent values lies on a straight line library(car) crPlots(fit.lm) 22
Linear Regression Model diagnostic: the dependent values are independent of each other Durbin-Watson Test computes residual autocorrelations and generalized Durbin-Watson statistics and their bootstrapped p-values 23
Linear Regression Influential points Cook s distance 24
Linear Regression Multivariate model Univariate analysis p-value Adjusted R-squared Height Age Gender Smoke <2.2e-16 <2.2e-16 1.96E-07 4.61E-11 0.7602 0.5676 0.03935 0.06311 25
Linear Regression Multivariate model 26
Linear Regression Multivariate model 27
Linear Regression Variable/feature selection Forward/Backward/Stepwise regression analysis step(): AIC or BIC 28
Linear Regression Variable/feature selection Forward/Backward/Stepwise regression analysis step(): AIC or BIC 29
Nonlinear regression Infant Mortality Rate vs Gross Domestic Product Quadratic model LOESS: LOcal regrESSion https://databank.worldbank.org/reports.aspx?source=2&series=SP .DYN.IMRT.IN&country= 30
Nonlinear regression IMR vs GDP World Bank data of 2018, n = 187 countries 31
Nonlinear regression IMR vs GDP 32
Nonlinear regression Quadratic model 33
Nonlinear regression Quadratic model 34
Nonlinear regression Quadratic model 35
Nonlinear regression Quadratic model 36
Nonlinear regression loess() 37
Nonlinear regression loess() 38
Nonlinear regression loess() 39