Regression Concepts
Regression analysis explores the relationship between variables, with concepts such as regression coefficients, t-values, R-squared, and adjusted R-squared providing insights into model significance and explanatory power.

Download Presentation

Please find below an Image/Link to download the presentation.
The content on the website is provided AS IS for your information and personal use only. It may not be sold, licensed, or shared on other websites without obtaining consent from the author.If you encounter any issues during the download, it is possible that the publisher has removed the file from their server.
You are allowed to download the files provided on this website for personal or commercial use, subject to the condition that they are used lawfully. All files are the property of their respective owners.
The content on the website is provided AS IS for your information and personal use only. It may not be sold, licensed, or shared on other websites without obtaining consent from the author.
E N D
Presentation Transcript
Regression Concepts Dr. Dyal Bhatnagar
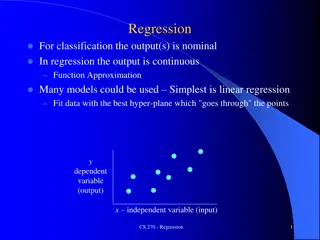
Regression Regression tells about the causal relationship among variables There is a Dependent Variable whose values depend upon one or many Independent Variables or predictors or regressors. Yi= + Xi+ I Where, Yi is the Dependent Variable in time i. Xi is the Independent Variable in time i. is the intercept of the regression line. is the slope of the regression line and is called the Regression Coefficient. Regression coefficients indicate the relationship of the Independent Variable with the Dependent Variable. I is the error term or the disturbance term.
Regression Notations: Regression coefficients Unstandardised Regression Coefficients are the original values with there SE (Standard Error) SE is the Standard Deviation of sample means. Thus, a lesser SE would mean that the sample is representative of the population and the is more reliable. Standardised Regression Coefficients tell us the number of change in the Dependent Variable as a result of 1 change in Independent Variable. Thus, they are not dependent on the units of measurement and therefore are directly comparable.
Regression Notations: t-value t-value = /SE If t-value > 1.96 or its p-value < 0.05, is significant at 5% level of significance If t-value > 2.58 or its p-value < 0.01, is significant at 1% level of significance The larger the t-value and smaller the p-value, greater is the contribution of that predictor. Coefficients can be ranked as per their t-values.
Regression Notations: Multiple R and R2 Multiple R = Correlation between Y and R2(Coefficient of determination) tells as to how much variation in the Dependent Variable is explained by all Independent Variables together R2= Explained variation/Total variation The only way to increase R2is to increase the number of Independent Variables
Regression Notations: Adjusted R2 There is a lot of argument regarding what the adjusted R2is adjusted for. Adjusted for degrees of freedom, or Adjusted for number of predictors, Suppose you compare a five predictor model with a higher R2to a one predictor model. Does the five predictor model have a higher R2because its better or is the R2higher because it has more predictors? Simple compare the adjusted R2values to find out. Adjusted for sampling error It tells how much variation in dependent Variable would be accounted for if the model has been derived from the population from which the sample has been taken -Andy Field
Regression Notations: F-stats F-statistics in ANOVA table Higher the F-statistics better it is. Hoof F-test in regression is that all s in regression equation are equal to zero. Rejection of Ho would mean that at-least one of the s is significant p-value of F-stat < 0.05 indicates that the F-stat value is significant and the model is fit and capable of predicting Dependent Variable.
Regression Model: Assumptions I(Error terms) in different time periods must not be correlated : No Auto-Correlation Required only in case of Time-Series Data and not for Cross-Sectional Data Durbin Watson Test: Values near 2 are acceptable Variance of all I(Error terms) in different time periods is constant: Homoscadicity (No Hetroscadicity) All I(Error terms) in different time periods should be normally distributed KS Test or various Plots
Regression Model: Assumptions In different time periods the I(Error terms) and regressors (Xi) must not be correlated: Exogenity (No Endogenity) regressors (Xi) should not have high degree of correlation among them: No Multi-Collinearity VIF (Variance Inflation Sector) > 10 is a cause of concern Tolerance is inverse of VIF, should be <0.1 All I(Error terms) in different time periods shall have a zero mean PLEASE NOTE THAT ALMOST ALL ASSUMPTIONS ARE RELATED TO THE ERROR TERM