Quantitative Chemical Analysis
In this chapter, learn about the types of errors in chemical analysis, including random and systematic errors. Explore the uncertainty in measurement, precision, and accuracy concepts. Understand significant figures and rules for counting them correctly.

Download Presentation

Please find below an Image/Link to download the presentation.
The content on the website is provided AS IS for your information and personal use only. It may not be sold, licensed, or shared on other websites without obtaining consent from the author.If you encounter any issues during the download, it is possible that the publisher has removed the file from their server.
You are allowed to download the files provided on this website for personal or commercial use, subject to the condition that they are used lawfully. All files are the property of their respective owners.
The content on the website is provided AS IS for your information and personal use only. It may not be sold, licensed, or shared on other websites without obtaining consent from the author.
E N D
Presentation Transcript
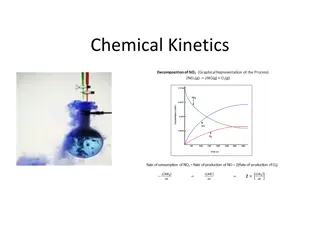
Quantitative Chemical Analysis Chapter 5 Errors in Chemical Analysis
Experimental Error The propagation of uncertainty in lab calculations
Uncertainty in Measurement A digit that must be estimated is called uncertain. A measurement always has some degree of uncertainty.
Buret 01_08 mL 0 10 22.2 mL 20 30 40 50
Precision and Accuracy Accuracy refers to the agreement of a particular value with the true value. Precision refers to the degree of agreement among several elements of the same quantity.
Types of Error Random Error (Indeterminate Error) - measurement has an equal probability of being high or low. Systematic Error (Determinate Error) - Occurs in the same direction each time (high or low).
Rules for Counting Significant Figures - Overview 1. 2. Nonzero integers Zeros - leading zeros - captive zeros - trailing zeros Exact numbers 3.
Rules for Counting Significant Figures - Details Nonzero integers always count as significant figures. 3456 has 4 sig figs.
Rules for Counting Significant Figures - Details Zeros Leading zeros do not count as significant figures. - 0.0486 has 3 sig figs.
Rules for Counting Significant Figures - Details Zeros - Captive zeros always count as significant figures. 16.07 has 4 sig figs.
Rules for Counting Significant Figures - Details Zeros - Trailing zeros are significant onlyif the number contains a decimal point. 9.300 has 4 sig figs.
Rules for Counting Significant Figures - Details Exact numbers have an infinite number of significant figures. 1 inch = 2.54 cm, exactly
Rules for Significant Figures in Mathematical Operations Multiplication and Division: # sig figs in the result equals the number in the least precise measurement used in the calculation. 6.38 2.0 = 12.76 13 (2 sig figs)
Rules for Significant Figures in Mathematical Operations Addition and Subtraction: # decimal places in the result equals the number of decimal places in the least precise measurement. 6.8 + 11.934 = 18.734 18.7 (3 sig figs)
logs and antilogs log 4.6 = 0.66 log 345 = 2.538 log 2.98 x 109 = 9.474 antilog(3.56) = 3.6 x 10³ 10(3.56) = 3600
Propagation of Uncertainty From random error From systematic error
Rules for Propagation of Uncertainty
Significant Figures The Real Rule The first digit of the absolute uncertainty is the last significant digit in the answer 4.178 x 0.07895 = 0.3299 ( 0.001) so answer should be 0.330 ( 0.001)