Quality Assessment in Bond Pull Testing for High Reliability Experiments
Understanding destructive test outcomes, optimal bonding parameters, and quality criteria in bond pull tests for high-reliability physics experiments. Insights from various test results and recommendations for acceptable standards explained.
Download Presentation

Please find below an Image/Link to download the presentation.
The content on the website is provided AS IS for your information and personal use only. It may not be sold, licensed, or shared on other websites without obtaining consent from the author.If you encounter any issues during the download, it is possible that the publisher has removed the file from their server.
You are allowed to download the files provided on this website for personal or commercial use, subject to the condition that they are used lawfully. All files are the property of their respective owners.
The content on the website is provided AS IS for your information and personal use only. It may not be sold, licensed, or shared on other websites without obtaining consent from the author.
E N D
Presentation Transcript
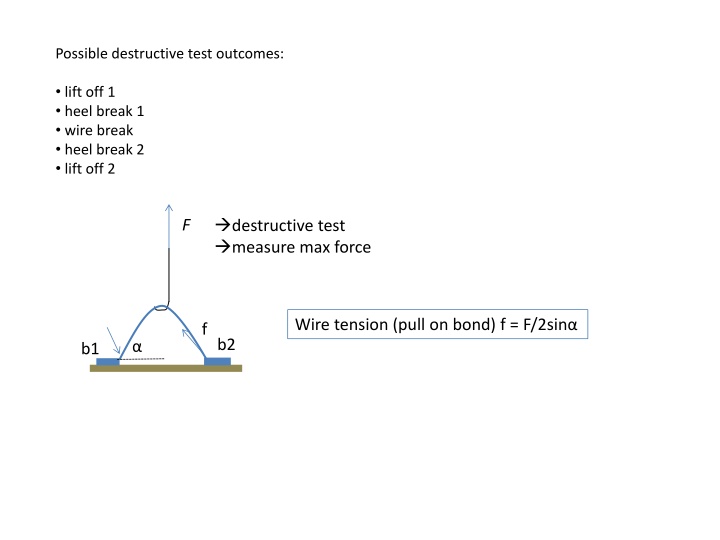
Possible destructive test outcomes: lift off 1 heel break 1 wire break heel break 2 lift off 2 destructive test measure max force F Wire tension (pull on bond) f = F/2sin f b2 b1
CERN PH-EP-Tech-Note-2011-002 In general, an acceptable quality in a standard bond pull test for a high reliability physics experiment application would be: 1) no failure to make bonds during the bonding of the test wires (or less than 1% if 100 or more wires are made) 2) mean pull strength of >8 g and and RMS of <1 g 3) at least 75% heel breaks or mid-span breaks Note that a typical good quality bonding surface would result in no failures in bonding (<<1%), a mean pull strength of 10-12 g, an RMS of < 0.5 g, and > 95 % heel or mid-span breaks.
Oxford bus tape test Pull Test Results Measured pull tests on samples with and without plasma cleaning. All tests good, i.e. break at heel. Much better than recommended QC by wire bonding group: Mean 5 sigma > 2.5 g No significant difference with plasma cleaning (differences less than 2 sigma). With 37 10.02 0.88 5.64 Without Plasma clean 44 10.35 1.03 5.20 Number of pulls Mean (g) RMS (g) Mean-5 sigma (g)
CICOREL ELGOLINE Bonder Parameters Time Power 35 100 35 100 35 100 35 100 25 80 25 80 35 80 35 85 35 95 35 85 25 85 25 85 25 85 25 90 25 95 30 95 30 90 30 85 Mostly heel break 1 Pull Test Mean 4.17 10.98 6.49 3.5 10.55 11.28 11.33 7.62 4.1 5.99 9.5 11.85 10.38 9.21 7.87 6.09 7.43 10.1 Lot 2 3 4 5 6 7 8 9 10 11 12 13 14 15 16 17 18 19 Force 20 10 16 24 24 16 16 16 24 24 24 16 20 20 20 20 20 20 Sum Par 155 145 151 159 129 121 131 136 154 144 134 126 130 135 140 145 140 135 Std 1.56 0.55 1.37 0.84 0.78 0.58 0.28 1.33 1.08 1.01 1.33 0.85 0.96 1.28 1.58 2.21 2.34 1.54 Lot No.Time 2 3 4 5 6 7 8 9 10 11 12 Force b1 Force b2 Sum Par Mean scaled Power Mean Std 7.8 6.22 3.92 4.68 3.75 8.94 7.36 8.19 7.68 7.72 6.82 30 30 30 30 30 30 35 40 50 60 65 90 95 16 16 16 16 16 16 16 16 16 16 16 18 18 18 18 18 18 18 18 18 18 18 137 142 147 152 157 132 137 142 152 162 167 1.09 2.06 0.65 1.51 0.71 1.95 2.75 1.89 1.4 1.99 2.86 6.32 5.04 3.18 3.79 3.04 7.24 5.96 6.63 6.22 6.25 5.52 100 105 110 85 85 85 85 85 85 Doesn t bond at best settings for CICOREL Mostly lift off 2
Mean force vs. Bond parameters: Cicorel: low wire deformation larger force Elgoline: not much correlation fail because of lift off (doesn t depend on wire deformation) cicorel
Cicorel Elgoline
