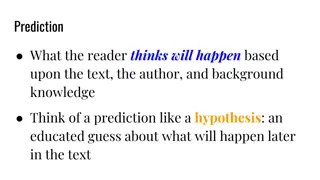
Psychrometrics: Air Properties & Behavioral Predictions

Introduction to Energy
Management
Week/Lesson 5
Psychrometrics: The Properties
of Air
After completing this chapter, you will be able to
:
Define psychrometry, the psychrometric chart and
psychrometrics
Describe the composition of air
Explain Boyle’s, Charles’ and Dalton’s laws
Read a psychrometric chart
Use the psychrometric chart to determine the
effects of latent and sensible
heat on air
Psychrometrics: The Properties of Air
•
Psychrometry — the study of air,
temperature and water vapor relationships
•
Psychrometric chart — graphical
representation of these relationships
•
Psychrometrics — combination of the
concepts of psychrometry and the
psychrometric chart
Psychrometrics: The Properties of Air
The Composition of Air
Dry air — 77% nitrogen, 22% oxygen, 0.04%
carbon dioxide, 0.96% other gases
Water vapor — evaporation and transpiration
Airborne impurities
•
Smoke, dust, pollen, bacteria, noxious gases
•
Particulate matter or gases
Psychrometrics: The Properties of Air
Predicting Air’s Behavior
Boyle’s Law
— Gas shrinks in volume when
pressurized at constant temperature
Charles’ Law
— Gas expands when heated at
constant pressure
Dalton’s Law of Partial Pressures
— Total pressure
of a gaseous mixture is the sum of the pressures
of the individual gases
Psychrometrics: The Properties of Air
Water Vapor in Air — Latent Heat of
Vaporization
Equal to 970 Btus/lb of water vapor
Heat added to water causes evaporation
Heat removed from water vapor causes
condensation
Psychrometrics: The Properties of Air
Defining Humidity
Humidity — airborne moisture
Specific humidity — weight of water vapor in dry
air
Relative humidity — percentage of moisture
saturation in air
Dew point — point at which air has a relative
humidity of 100%
Psychrometrics: The Properties of Air
Measuring Humidity
Wet bulb temperatures
Dry bulb temperatures
Sling psychrometer
Psychrometric table
Psychrometric chart
Psychrometrics: The Properties of Air
Example 5-1
Dry bulb temperature = 92
ºF
Wet bulb temperature = 89ºF
Use Percent Relative Humidity Table
Difference between temperatures is 3ºF
The point of intersection
is 89% RH
Psychrometrics: The Properties of Air
Other Psychrometric Properties of Air
Specific Volume of air – cu ft/lb dry air
Enthalpy – Btu/lb dry air
Introduction to the Psychrometric Chart
Plotted graph of tables of moist air properties
Standardized at sea level pressure
Psychrometrics: The Properties of Air
Constructing the Psychrometric Chart
Dry bulb temperature scale along the bottom
•
Constant dry bulb represented by vertical
lines
Moisture measurements along the right side
•
Constant moisture represented by
horizontal lines
Dew point line
•
Upward curved line at left of chart
•
Also known as the 100%
humidity line
Psychrometrics: The Properties of Air
Examining the Psychrometric Chart
When two properties are known, the others
can be read from the chart
•
Dry and wet bulb temperatures
•
Relative humidity and dew point
•
Enthalpy
•
Specific volume
Psychrometrics: The Properties of Air
Example 5-3
Wet bulb temperature of 61 degrees
Dry bulb temperature of 75 degrees
Intersection of these two lines
•
42% relative humidity
Psychrometrics: The Properties of Air
Dew Point
•
The temperature which moisture starts to
condense out of the air.
•
Dew point is also known as saturation
temperature.
•
Dew point temperature is determined by moving
from a state point horizontally to the left along
lines of constant humidity ratio until the upper,
curved, saturation temperature boundary is
reached.
Air temperature
Relative humidity
Air movement
Surface
temperatures
Air quality (IAQ)
Lighting
•
quality
•
quantity
Acoustics
Security
Building Envelop -The Third Skin
The 3
rd
. skin moderates the differences between the
natural environment and the built environment
7
5
d
e
g
r
e
e
s
6
5
d
e
g
r
e
e
s
+100
- 5
dew point
Saturation
Line
30°
40°
50°
60°
70°
80°
Temperatures are read at the
Saturation line from a set
point to the left along
humidity ratio lines.
The combined affects of
environmental
conditions on
comfort
•
Air temperature
•
Relative humidity
•
Air movement
•
Surface radiation
Dry Bulb Temperature Reading
C
h
a
n
g
e
i
n
q
u
a
n
t
i
t
y
o
f
w
a
t
e
r
i
n
t
h
e
a
i
r
Change in quantity of water in the air
The psychrometric
chart
Charts the combined affects of air
temperature and moisture content
Breakdown of the Lines
50% RH
Psychrometric Chart
D
e
f
i
n
i
t
i
o
n
o
f
R
e
l
a
t
i
v
e
H
u
m
i
d
i
t
y
The amount of moisture in the air
expressed as a percentage of the
maximum amount of moisture the air can
hold at the given temperature.
Example: at dry bulb temp. of 77 and wet
bulb temp. of 63, the air is holding 50% of
it
’
s maximum capacity at 77 degrees.
Enter dry bulb reading
Enter wet bulb reading
warming
cooling
drying
Adding
moisture
warming
cooling
drying
Adding
moisture
W
a
r
m
&
D
r
y
C
o
o
l
&
H
u
m
i
d
Winter
Summer
Energy efficient zones
Winter:
higher humidity off-sets
lower furnace thermostat setting
Summer:
lower humidity off-sets
higher AC thermostat setting
50% RH
Air is 100% saturated
with moisture and
condensation begins
The saturation curve
50% RH
Air is 100% saturated
with moisture and
continues to cool
Moisture removed
by condensation
What if cooling
continues ?
50% RH
Air is 100% saturated
with moisture and
continues to cool
Moisture removed
by condensation
S
a
m
e
a
i
r
i
s
r
e
h
e
a
t
e
d
t
o
7
0
d
e
g
r
e
e
s
a
n
d
n
o
m
o
i
s
t
u
r
e
a
d
d
e
d
–
R
H
o
f
t
h
e
r
o
o
m
g
o
e
s
d
o
w
n
(
d
r
y
e
r
)
Dry Bulb Temperature Reading
C
h
a
n
g
e
i
n
q
u
a
n
t
i
t
y
o
f
w
a
t
e
r
i
n
t
h
e
a
i
r
Change in quantity of water in the air
Chart Exercises
What is the RH in the classroom?
Dry bulb ________
Wet bulb _________
RH = _________
Dry Bulb Temperature Reading
C
h
a
n
g
e
i
n
q
u
a
n
t
i
t
y
o
f
w
a
t
e
r
i
n
t
h
e
a
i
r
Change in quantity of water in the air
Chart Exercises
Based on the current room RH, how
cool would the walls need to get to
start noticing condensation ?
Dry bulb ________
Wet bulb _________
RH = _________
Chart Exercises
Assume the room is at pt.
“
A
”
when class
begin and we are comfortable, which
direction would room condition tend to
move toward as a response to our
presents ?
Mechanically: (Summer)
we need to (add or remove heat)
we need to (add or remove moisture)
A - Room starts out
here
B
C
D
E
Explore the realm of psychrometrics and delve into the properties of air, including its composition, behavior based on fundamental laws, water vapor content, and humidity levels. Gain insights into utilizing psychrometric charts and understanding latent and sensible heat effects on air.

Download Presentation

Please find below an Image/Link to download the presentation.
The content on the website is provided AS IS for your information and personal use only. It may not be sold, licensed, or shared on other websites without obtaining consent from the author.If you encounter any issues during the download, it is possible that the publisher has removed the file from their server.
You are allowed to download the files provided on this website for personal or commercial use, subject to the condition that they are used lawfully. All files are the property of their respective owners.
The content on the website is provided AS IS for your information and personal use only. It may not be sold, licensed, or shared on other websites without obtaining consent from the author.
E N D
Presentation Transcript
Introduction to Energy Management
Week/Lesson 5 Psychrometrics: The Properties of Air
Psychrometrics: The Properties of Air After completing this chapter, you will be able to: Define psychrometry, the psychrometric chart and psychrometrics Describe the composition of air Explain Boyle s, Charles and Dalton s laws Read a psychrometric chart Use the psychrometric chart to determine the effects of latent and sensible heat on air
Psychrometrics: The Properties of Air Psychrometry the study of air, temperature and water vapor relationships Psychrometric chart graphical representation of these relationships Psychrometrics combination of the concepts of psychrometry and the psychrometric chart
Psychrometrics: The Properties of Air The Composition of Air Dry air 77% nitrogen, 22% oxygen, 0.04% carbon dioxide, 0.96% other gases Water vapor evaporation and transpiration Airborne impurities Smoke, dust, pollen, bacteria, noxious gases Particulate matter or gases
Psychrometrics: The Properties of Air Predicting Air s Behavior Boyle s Law Gas shrinks in volume when pressurized at constant temperature Charles Law Gas expands when heated at constant pressure Dalton s Law of Partial Pressures Total pressure of a gaseous mixture is the sum of the pressures of the individual gases
Psychrometrics: The Properties of Air Water Vapor in Air Latent Heat of Vaporization Equal to 970 Btus/lb of water vapor Heat added to water causes evaporation Heat removed from water vapor causes condensation
Psychrometrics: The Properties of Air Defining Humidity Humidity airborne moisture Specific humidity weight of water vapor in dry air Relative humidity percentage of moisture saturation in air Dew point point at which air has a relative humidity of 100%
Psychrometrics: The Properties of Air Measuring Humidity Wet bulb temperatures Dry bulb temperatures Sling psychrometer Psychrometric table Psychrometric chart
Psychrometrics: The Properties of Air Example 5-1 Dry bulb temperature = 92 F Wet bulb temperature = 89 F Use Percent Relative Humidity Table Difference between temperatures is 3 F The point of intersection is 89% RH
Psychrometrics: The Properties of Air Other Psychrometric Properties of Air Specific Volume of air cu ft/lb dry air Enthalpy Btu/lb dry air Introduction to the Psychrometric Chart Plotted graph of tables of moist air properties Standardized at sea level pressure
Psychrometrics: The Properties of Air Constructing the Psychrometric Chart Dry bulb temperature scale along the bottom Constant dry bulb represented by vertical lines Moisture measurements along the right side Constant moisture represented by horizontal lines Dew point line Upward curved line at left of chart Also known as the 100% humidity line
Psychrometrics: The Properties of Air Examining the Psychrometric Chart When two properties are known, the others can be read from the chart Dry and wet bulb temperatures Relative humidity and dew point Enthalpy Specific volume
Psychrometrics: The Properties of Air Example 5-3 Wet bulb temperature of 61 degrees Dry bulb temperature of 75 degrees Intersection of these two lines 42% relative humidity
Dew Point The temperature which moisture starts to condense out of the air. Dew point is also known as saturation temperature. Dew point temperature is determined by moving from a state point horizontally to the left along lines of constant humidity ratio until the upper, curved, saturation temperature boundary is reached.
Air temperature +100 Relative humidity Air movement - 5 Air quality (IAQ) Surface temperatures 75 degrees Acoustics Lighting quality 65 degrees quantity Security Building Envelop -The Third Skin The 3rd. skin moderates the differences between the natural environment and the built environment
dew point Saturation Line Temperatures are read at the Saturation line from a set point to the left along humidity ratio lines. MOISTURE CONTENT (BTU/LBAIR) 80 70 60 50 40 30
The combined affects of environmental conditions on comfort Air temperature Relative humidity Air movement Surface radiation
The psychrometric chart Charts the combined affects of air temperature and moisture content Change in quantity of water in the air Dry Bulb Temperature Reading
Breakdown of the Lines Enthalpy BTU / lb Dry Blub Relative Humidity Dew Point Grains of Moisture Specific Volume Wet Blub 100% Saturation
Psychrometric Chart Definition of Relative Humidity The amount of moisture in the air expressed as a percentage of the maximum amount of moisture the air can hold at the given temperature. Example: at dry bulb temp. of 77 and wet bulb temp. of 63, the air is holding 50% of it s maximum capacity at 77 degrees. Enter wet bulb reading 50% RH Enter dry bulb reading
Adding moisture cooling warming drying
Energy efficient zones Winter: lower furnace thermostat setting higher humidity off-sets Summer: lower humidity off-sets higher AC thermostat setting Adding moisture Winter Cool & Humid warming cooling Warm & Dry drying Summer
The saturation curve Air is 100% saturated with moisture and condensation begins 50% RH
What if cooling continues ? Air is 100% saturated with moisture and continues to cool 50% RH Moisture removed by condensation
Air is 100% saturated with moisture and continues to cool 50% RH Moisture removed by condensation Same air is reheated to 70 degrees and no moisture added RH of the room goes down (dryer)
Chart Exercises What is the RH in the classroom? Dry bulb ________ Wet bulb _________ RH = _________ Change in quantity of water in the air Dry Bulb Temperature Reading
Chart Exercises Based on the current room RH, how cool would the walls need to get to start noticing condensation ? Dry bulb ________ Change in quantity of water in the air Wet bulb _________ RH = _________ Dry Bulb Temperature Reading
Chart Exercises Assume the room is at pt. A when class begin and we are comfortable, which direction would room condition tend to move toward as a response to our presents ? Mechanically: (Summer) we need to (add or remove heat) we need to (add or remove moisture) C B D A - Room starts out here E