Projections Analysis for Financial and Credit Analysts
In Chapter 17 of Credit Risk Management & Analysis, the focus is on Projections Analysis for both financial and credit analysts. The role of these analysts is to evaluate future income and cash flow of a firm. They build financial models starting with a base case, customize revenue drivers, assess industry benchmarks, and make adjustments for different scenarios like upside, downside, and breakeven cases.
Download Presentation

Please find below an Image/Link to download the presentation.
The content on the website is provided AS IS for your information and personal use only. It may not be sold, licensed, or shared on other websites without obtaining consent from the author. If you encounter any issues during the download, it is possible that the publisher has removed the file from their server.
You are allowed to download the files provided on this website for personal or commercial use, subject to the condition that they are used lawfully. All files are the property of their respective owners.
The content on the website is provided AS IS for your information and personal use only. It may not be sold, licensed, or shared on other websites without obtaining consent from the author.
E N D
Presentation Transcript
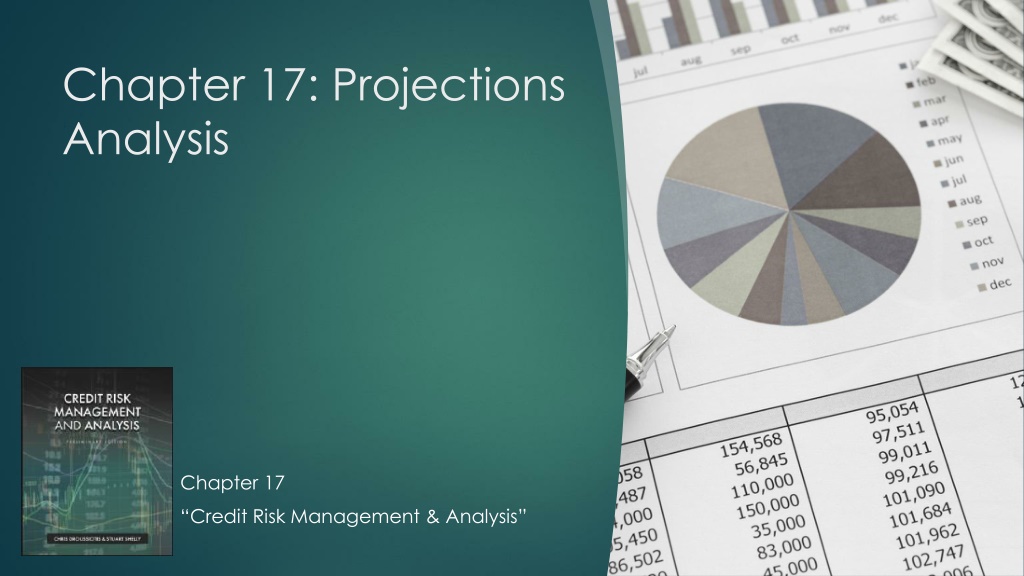
Chapter 17: Projections Analysis Chapter 17 Credit Risk Management & Analysis
Projections Overview The main role of both the financial analyst and credit analyst is to measure the future income and cash flow of the firm. The financial analyst, representing the equity investors, is trying to determine the value the corporation based on the future cash flows. The credit analyst, representing the debt holder, is trying to determine if the current debt is high or low based on the future cash flows. Also, the credit analyst is measuring how much debt the company can handle for a given transaction.
Projections Building the Financial Model All analysts, including the credit analyst, equity financial analyst, or the company that is in the process of raising capital, start with the base case. The base case is the first approach to building the financial model. Since this model will be shared with all the stakeholders, including bankers, investors, and management, the case needs to be simple, reasonable, and basic before any adjustments that need to be made to run other scenarios, such as the upside case, downside case and breakeven case.
Projections Building the Financial Model Building the Base Case The base case is the first projected scenario that the analyst sets up before making any of his or her own customized adjustments. Depending on the circumstances, the assumptions to build this case are either given directly by management as part of the plan to raise capital or the analyst independently builds it to determine the value of the company, as later described in chapter 18. When building this case, it is important for the analyst to arrange the revenue drivers or the cost assumptions so that are in line with industry standards and so the proper comparison can be made for follow-up adjustments.
Projections Building the Financial Model Revenue Drivers The revenue drivers are customized based on the industry performance measurements that the company competes in. This makes it easier to compare the results versus the industry operating benchmarks. For example, the assumptions used for a hotel company could be based on the average daily rate (ADR) representing what the customer will pay to rent the room for a night; the number of rooms available per property; and the occupancy rate (OR), which represents the rooms that are rented as a percentage of total available rooms. A common benchmark that is used in the hotel business is revenue per available room (RevPAR), calculated by multiplying the ADR by OR. For manufacturing companies, the revenues are typically driven by volume and price. The analyst will assume a volume growth and price increase/decrease assumption to drive the future revenue. The best starting approach of setting up these assumptions is to use historical growth rates and extend them going forward. Then the analyst can use discretion to adjust these numbers based on expectation.
Projections Building the Financial Model Celerity Technogy Inc. ("CTI") REVENUE ASSUMPTIONS BASE CASE HISTORICAL PROJECTED Year -1 Year 0 Year 1 Year 2 Year 3 Year 4 Year 5 Year 6 Year 7 Revenues by Geography Volume Growth U.S. Europe Asia Total Volume Growth 7.50% 10.87% 21.95% 8.53% 5.00% 10.00% 20.00% 6.34% 4.50% 8.00% 18.00% 5.68% 3.00% 6.00% 15.00% 4.12% 2.50% 4.00% 12.00% 3.34% 2.00% 2.00% 8.00% 2.44% 2.00% 2.00% 8.00% 2.46% 2.00% 2.00% 8.00% 2.48% Volume Sold (000's Units) U.S. Europe Asia Total Volume 16,000 2,300 19,120 17,200 2,550 1,000 20,750 18,060 2,805 1,200 22,065 18,873 3,029 1,416 23,318 19,439 3,211 1,628 24,278 19,925 3,340 1,824 25,088 20,323 3,406 1,970 25,699 20,730 3,475 2,127 26,332 21,144 3,544 2,297 26,986 In figure 17.1, Celerity Technology Company shows a breakdown of revenues by geography. 820 Price Increase U.S. Europe Asia Total Price Increase 6.98% 5.23% 2.50% 6.54% 4.00% 5.00% 3.00% 4.05% 3.50% 4.50% 3.00% 3.57% 3.00% 4.00% 3.00% 3.10% 2.50% 3.00% 3.00% 2.56% 2.50% 2.50% 2.50% 2.47% 2.50% 2.50% 2.50% 2.46% 2.50% 2.50% 2.50% 2.46% Each region then is projected based on historical average unit volume growth and price increases per unit. Sales Price per Unit ($) U.S. Europe Asia Average Price 50.00 $ 52.17 $ 48.78 $ 50.21 $ $ $ $ $ 53.49 54.90 50.00 53.49 $ $ $ $ 55.63 57.65 51.50 55.66 $ $ $ $ 57.57 60.24 53.05 57.65 $ $ $ $ 59.30 62.65 54.64 59.43 $ $ $ $ 60.78 64.53 56.28 60.96 $ $ $ $ 62.30 66.14 57.68 62.46 $ $ $ $ 63.86 67.80 59.12 64.00 $ $ $ $ 65.46 69.49 60.60 65.57 In this case, despite the 2-year historical assumptions that show high total revenue growth rates of 15.6%, the analyst is adjusting these numbers for the future to lower revenue growth rates to perhaps show a more moderate rate of growth (from 9.45% down to 4.96% in year 5). Revenues by Geography U.S. Europe Asia Total Revenue Total Revenue Growth 800,000 120,000 40,000 960,000 920,000 140,000 50,000 1,110,000 15.6% 1,004,640 161,700 61,800 1,228,140 1,086,594 182,495 75,112 1,344,200 1,152,767 201,182 88,970 1,442,919 1,211,126 215,506 102,636 1,529,268 1,266,232 225,312 113,618 1,605,161 1,323,846 235,563 125,775 1,685,184 1,384,081 246,282 139,233 1,769,595 9.2% 9.5% 7.3% 6.0% 5.0% 5.0% 5.0% Revenue Growth U.S. Europe Asia Total Price Increase 15.00% 16.67% 25.00% 15.63% 9.20% 15.50% 23.60% 10.64% 8.16% 12.86% 21.54% 9.45% 6.09% 10.24% 18.45% 7.34% 5.06% 7.12% 15.36% 5.98% 4.55% 4.55% 10.70% 4.96% 4.55% 4.55% 10.70% 4.99% 4.55% 4.55% 10.70% 5.01% Figure 17.1
Projections Building the Financial Model Revenue Drivers In setting up the projected revenue drivers the following assumptions are typically needed to be considered: Historical averages Industry drivers based demand and supply Organic and inorganic volume growth Price assumptions Contractual revenues Cyclical revenues Newly Established Companies
Revenue Assumption Drivers by Industry Industry Airline Revenue Drivers Revenue Passenger Mile (RPM); Miles Travelled (MT) per Day, Available Seat Miles (ASM) Revenue Formula Revenue = RPM x MT x 365 days Comments MT as % of ASM to indicate the activity of the airline during certain periods - an indusry benchmark used to compare between seasonal and non-seasonal periods and versus com pany peers. Projections Building the Financial Model Consumer Communications, Digital Media and Networking Average Revenue per User (ARPU) per month, Number of Users (NofU) Revenue = ARPU x NofU x 12 months ARPU could be recorded per month, or per year. The Numbe rof Users could be broken down by existing and new users. Hotel Average Daily Rates (ADR); Occupancy Rate (OR); Numbers of Rooms (NofR); Revenue Per Available Room (RevPAR) Revenue = ADR x OR x NofR x 365 days RevPar = ADR x OR Total Yearly Rooms = NofR x 365 days, so Revenues = RevPAR x Total Yearly Rooms For more detailed analysis the ADR and OR could be broken down into weekdays and weekends. A typical benchmark used in the industry is RevPAR. Manufacturing Volume (V); Price (P) Revenue = Unit Volume x Price per Unit Companies with multiple products could share the unit prices and volumes so the analyst could better project the revenues Restaurant Average Check (AC); Turnover (TO) per day; Number of Seats (NofS) Revenue = AC x TO x NofS x 365 days For more detailed analysis the AC and TO could be broken down into different shifts (Breakfast, Lunch, Dinner) a well as weekdays and weekends Retail Average sales Price per Square Footage (APSF); Total Square Footage; Total Stores (TS); Average Square Footage Per Store (ASFPS); Number of Customers per store per year ( C ) Revenue = APSF x TS x ASFPS x C Shipping/Transportation/Freig ht Revenue Ton-Mile (RTM); Gross Ton Mile (GTM) Software as a Service (SaaS) Net Monthly Recurring Revenue (MRR); Number of Bookings (NofB); Churning Rate (CR); Figure 17.2
Projections Building the Financial Model Cost Assumptions The analysts typically rely on historical cost amounts in relationship to revenues. The projected revenue is the basis for estimating the company s total costs going forward. The premise is that as the company grows, the cost will probably grow at the same pace as revenues. Direct costs, such as cost of goods sold, which includes labor, materials, and overhead expenses, are expected to grow at the same percentage of revenues. Indirect costs though, such as selling, general, and administrative expenses, expect to grow from year to year at a higher or lower growth rate than revenues, depending on where the company stands in its promotional cycle. New companies spend more on up-front SG&A as they are positioning the company to grow in the future. Mature companies SG&A typically grow at a slower pace than revenue, contributing to higher EBITDA margins from the year before. For conservative purposes though, is not unusual to see that the analysts assume that these indirect operating expenses for a mature company grow at the same rate as revenues; therefore, they are running these costs as a percentage of revenues.
Projections Building the Financial Model Celerity Technogy Inc. ("CTI") INCOME STATEMENT COST ASSUMPTIONS BASE CASE HISTORICAL PROJECTED Year -1 Year 0 Year 1 Year 2 Year 3 Year 4 Year 5 Year 6 Year 7 Cost of Revenues as % of Revenue by Geography U.S. Europe Asia Total Cost of Rev. as % of Total Revenue 36.63% 32.50% 32.50% 35.94% 38.04% 35.71% 40.00% 37.84% 38.00% 35.00% 40.00% 37.71% 38.00% 35.00% 40.00% 37.70% 38.00% 35.00% 40.00% 37.71% 38.00% 35.00% 40.00% 37.71% 38.00% 35.00% 40.00% 37.72% 38.00% 35.00% 40.00% 37.73% 38.00% 35.00% 40.00% 37.74% Gross Margin by Geography U.S. Europe Asia Total Cost of Rev. as % of Total Revenue 63.38% 67.50% 67.50% 64.06% 61.96% 64.29% 60.00% 62.16% 62.00% 65.00% 60.00% 62.29% 62.00% 65.00% 60.00% 62.30% 62.00% 65.00% 60.00% 62.29% 62.00% 65.00% 60.00% 62.29% 62.00% 65.00% 60.00% 62.28% 62.00% 65.00% 60.00% 62.27% 62.00% 65.00% 60.00% 62.26% Operating Expenses Assumptions Administrative & General Increase % Marketing Expenses as % of Total Revenue Other Operating Expenses as % of Total Rev. Total Operating Expenses as % of Total Rev. 13.79% 7.21% 1.08% 23.15% 5.00% 7.00% 1.00% 22.11% 5.00% 7.00% 1.00% 21.53% 5.00% 7.00% 1.00% 21.24% 5.00% 7.00% 1.00% 21.11% 5.00% 7.00% 1.00% 21.12% 5.00% 7.00% 1.00% 21.12% 5.00% 7.00% 1.00% 21.12% 7.81% 1.04% 23.96% Depreciation Expense % of Total Revenue 6.25% 5.86% 6.00% 6.00% 6.00% 6.00% 6.00% 6.00% 6.00% Figure 17.3
Projections Building the Financial Model Cost of goods sold: The cost of goods sold (COGS) includes the labor costs, material costs, and overhead costs. A detailed analysis would include the number of workers per shift, number of shifts, number of shifts per day, and average wages per worker to determine the cost of labor. A detailed analysis would also include the cost of inventory as a raw material and the energy costs that are spent to produce the manufacturing units (overhead expenses). Most of the analysts though don t have such detailed information, so it is typical to use the historical COGS as percentage of revenue to run the projections. Sometimes, the COGS are given by segment or by product, which will be helpful to project the cost going forward and being able to make different assumptions based on each segment dynamics. In a typical transaction that the company is seeking financing, the management lays its cost strategy, which could include cost savings that need to be incorporated in the projections. Other information that is useful for the analyst is the capacity utilization. This is measured as a percentage of the actual volume output per year to the maximum yearly output, assuming 100% of the manufacturing facility is running at its peak.
Projections Building the Financial Model Operating expenses: The operating expenses include the selling or the expenses to market the company s products, administrative expenses for indirectly supporting the company s business, and any other general expenses that are not directly expenses based on the company s revenues. Other expenses in this category could include research and development expenses very important expenses, especially for companies that spend a lot of money to support the growth of the company. This segment could be looked at as separating the fixed costs and variable costs. If the company is positively growing at a healthy pace, the fixed costs could contribute higher margins, but if the company shows revenue declines, the fixed cost has a reverse impact to operating margins. The analyst needs to be aware of the sensitivity of the fixed expenses to revenue, especially the factors influencing the largest cost line items. For conservative purposes, analysts typically run the operating assumptions as a percentage of revenue. The better approach for general and administrative expenses is to assume a growth rate, so if the revenues decline, these expenses continue to grow, causing a problem for the company that needs to manage these expenses during tough periods. The selling or marketing expenses are typically run as percentages of revenues since these expenses directly support the revenue growth of the company
Projections Building the Financial Model Depreciation expenses: Depreciation expense, which is a non-cash expense, is typically projected based on the company s fixed assets using an average life. A lot of the analysis, though, since depreciation is not significant, is done using the same approach as any other expense: by calculating the depreciation as percentage of revenue, as seen previously in figure 17.3. It s not perfectly correct, but the argument is that since revenue grows so does the need to invest in capital to sustain the growth, hence the growth of depreciation at the same rate. t s important to compare the depreciation to the capital expenditures (Capex) found in the cash flow statement, as it need to be in line. Since depreciation expense is used primarily for tax benefits, it s important to make sure the amount is not excessively high, especially as it relates to capital expenditures. Typically for valuation purposes, depreciation is assumed to be equal with Capex, representing the minimum capital expenditures the company needs to spend to keep up with the devaluation of its assets or depreciation.
Balance Sheet Statement Net Worth or Shareholder s Equity Shareholder s equity measures the amount by which a company s assets exceed its liabilities at snapshot in time; basically, if one sold all that the company owns after paying all the obligations against these assets, the balance left is what the ownership will keep (figure 15.2). Shareholder s equity is also referred to as net worth or book value of equity. Included in this section are common stock, preferred stock, treasury stock, paid-in capital, and other equity and retained earnings. Common stock: This represents the original issuance of equity by the owners, and it will go down when the company buys back shares. Preferred stock: This could be an issuance by a third-party investor who expects the company to pay certain fixed dividends (like debt obligations). Treasury stock: Recorded as a negative number on the balance sheet, treasury stock represents shares that have been issued in the past but were repurchased by the company. The amount repurchased will reduce both par value and capital surplus on the balance sheet if the company decides to permanently retire the stock that was repurchased. If the company decides to re-issue the stock sometime in the future, the treasury stock will be set up at a separate account, reducing common stock and shareholder s equity. Paid-in capital: This represents proceeds from any additional equity investments invested in the company. Retained earnings: Retained earnings represent the cumulative income net of loses over time. The retained earnings could also be reducing if the company pays out dividends to shareholders or records loses.
Celerity Technogy Inc. ("CTI") Projections Building the Financial Model WORKING CAPITAL ASSUMPTIONS BASE CASE HISTORICAL PROJECTED Year -1 Year 0 Year 1 Year 2 Year 3 Year 4 Year 5 Year 6 Year 7 Accounts Receivable Accounts Receivable Turnover Accounts Receivable Days 21x 21x 21x 21x 21x 21x 21x 21x 17.26 17.26 17.26 17.26 17.26 17.26 17.26 17.26 Working capital activities: Working capital activity recorded in the cash flow statement is driven directly by year-to-year changes of the current assets minus current liability changes, as shown on the balance sheet statement. The current asset includes the accounts receivable, inventory, and other current assets such as prepaid expenses. The current liabilities include accounts payable and other current liabilities such as accrued income taxes and accrued expenses Inventory Inventory Turnover Inventory Days 11x 11x 11x 11x 11x 11x 11x 11x 32.59 32.59 32.59 32.59 32.59 32.59 32.59 32.59 Prepaid Expenses Prepaid Expenses as % of Revene 0.81% 0.81% 0.81% 0.81% 0.81% 0.81% 0.81% 0.81% Accounts Payable Accounts Payable Turnover Accounts Payable Days 11x 11x 11x 11x 11x 11x 11x 11x 32.59 32.59 32.59 32.59 32.59 32.59 32.59 32.59 Accrued Income Taxes Accrued Income Taxes as % of Revenues 1.25% 0.90% 0.90% 0.90% 0.90% 0.90% 0.90% 0.90% 0.90% Accrued Expenses Accrued Expenses as % of Revenues 1.04% 0.72% 0.72% 0.72% 0.72% 0.72% 0.72% 0.72% 0.72% Figure 17.4
Projections Building the Financial Model Working capital activities: Accounts receivable: The accounts receivable (AR) on the balance sheet are based on accounts receivable days (ARD) and accounts receivable turnover (ART) calculations. In Figure 16.4 the projected ARD used for the projections is based on historical average of 17.26 days or the average length of time that the customers pay starting from the day they are charged to pay for the merchandise. The formula is AR = [(ARD / 365) x revenues] Inventory: The inventory (Inv) on the balance sheet is based on inventory turnover (ITO) and inventory days (ID) calculations. In figure 16.4 the projected ID used for the projections used is based on the historical average of 11.20 days or the average length of time that the raw material bought from the suppliers turns into a finished good and a cash sale. The formula is Inv = [(ID / 365) x accounts payable]
Projections Building the Financial Model Working capital activities: Other current assets: For projection purposes, other current assets are based as a percentage of revenue. In figure 17.4 the projected prepaid expenses are calculated based on last year s percentage of revenues of 0.81%. Accounts payable: The accounts payable (AP) on the balance sheet are based on accounts payable days (APD) and accounts payable turnover (APT) calculations. In figure 17.4, like inventory, the projected APD that is used to calculate the projections is based on the historical average of 11.20 days or the average length of time that the company pays its bills to the vendors or suppliers the inventory. The formula is AP = [(APD /365) x accounts payable] Other current liabilities: For simplistic purposes, all other current liabilities on the balance sheet are calculated based on percentage of revenue. In figure 17.4 both the accrued income taxes and accrued expenses are based on percentage of revenues at 0.90% and 0.72%, respectively.
Projections Building the Financial Model Investment Activities Assumptions Capital Expenditures (CAPEX): For simplistic purposes, unless there are specific plans to spend a major one-time manufacturing plant improvements or major purchases of the truck fleet. One approach for the analyst is to run the Capex at the same percentage of Depreciation to Revenue representing low maintenance growth and any additional percentage of Capex to revenue should contribute directly to higher growth Long-Term Investments (LTI) These are projected to grow at the same level as the revenues calculated as percentage of revenues this is sometimes called Maintenance Capex .
Investment Activities Assumptions Capital Expenditures (CAPEX): For simplistic purposes, unless there are specific plans to spend a major one-time manufacturing plant improvements or major purchases of the truck fleet. Projections Building the Financial Model One approach for the analyst is to run the Capex at the same percentage of Depreciation to Revenue representing low maintenance growth and any additional percentage of Capex to revenue should contribute directly to higher growth Long-Term Investments (LTI) These are projected to grow at the same level as the revenues calculated as percentage of revenues this is sometimes called Maintenance Capex . Celerity Technogy Inc. ("CTI") INVESTMENT ACTIVITY ASSUMPTIONS BASE CASE HISTORICAL PROJECTED Year -1 Year 0 Year 1 Year 2 Year 3 Year 4 Year 5 Year 6 Year 7 Capital Expenditures Capital Expenditures as % of Revenue 11.26% 11.26% 11.26% 11.26% 11.26% 11.26% 11.26% 11.26% Long Term Investments Long Term Investments as % of Revenues 4.50% 4.50% 4.50% 4.50% 4.50% 4.50% 4.50% 4.50% Figure 17.5
Projections Building the Financial Model Financing activities assumptions: The financing activities shown in the cash flow statement consists of debt activities of borrowing or paying down the debt as well any equity activities including any distributions or issuance of new equity. The debt assumptions include the borrowing and repayment of debt, which are based on the contractual obligation between the company and its creditors. The equity component of the cash flow statement is based on specific plans for the company to make equity distributions to the existing investors or to raise new equity via public issuance or private placement offering. The repayment of debt shown on the cash flow statement is driven from the debt schedule table (figure 17.6) and described under the Debt Schedule Assumptions.
Projections Building the Financial Model Debt Schedule The debt schedule is built based on the four basic input criteria, also called money terms, typically seen in the credit agreements and bond indentures: amount borrowed (outstanding); the cost of borrowing (interest payment); the principal payment (scheduled or amortized debt payments); and the term of the debt facility representing how many years it takes to pay the loan. The debt outstanding drives the balance sheet, the interest payments drive the income statement, and the principal payment drives the cash flow statement. The interest rate charged could be set as fixed or floating and the principal payments are based on a set scheduled payment found in the agreement.
Projections Building the Financial Model Debt Schedule Figure 17.6 shows that the short-term and long-term debt interest payment is based on floating rate index London Inter Bank Offering Rate (LIBOR) starting at 2% plus a spread rate of 3%. LIBOR is a rate that most banks use as an interest rate benchmark, which represents the cost of a bank s borrowing from other banks. In this example, the projections assume an increase in LIBOR by 0.5% per year for the next 3 years and another 1% increase in year 4 before it stabilizes at that level. Please note that the interest payment is calculated based on last year s outstanding, conservatively assuming that the principal payment is paid on the last day of each year.
Celerity Technogy Inc. ("CTI") DEBT SCHEDULE BASE CASE HISTORICAL PROJECTED Year -1 Year 0 2.00% Year 1 2.50% 0.50% Year 2 3.00% 0.50% Year 3 3.50% 0.50% Year 4 4.50% 1.00% Year 5 4.50% 0.00% Year 6 4.50% 0.00% Year 7 4.50% 0.00% Interest Rate Forward Assumptions- LIBOR or SOFR LIBOR Incr./ (Decr.) Projections Building the Financial Model Short-Term Debt Spread Pricing (L + Spread) Interest Rate 3.00% 5.50% 3.00% 6.00% 3.00% 6.50% 3.00% 7.50% 3.00% 7.50% 3.00% 7.50% 3.00% 7.50% Outstanding Principal Payment Interest Payment Total Payment 20,000 10,000 10,000 10,550 - - - - - - - - - - - - - - - - - - - 550 Long-Term Debt Spread Pricing (L + Spread) Interest Rate 3.00% 5.50% 3.00% 6.00% 3.00% 6.50% 3.00% 7.50% 3.00% 7.50% 3.00% 7.50% 3.00% 7.50% Outstanding Principal Payment Interest Payment Total Payment 1,200,000 1,180,000 1,160,000 20,000 64,900 84,900 1,130,000 30,000 69,600 99,600 1,090,000 40,000 73,450 113,450 1,030,000 60,000 81,750 141,750 950,000 80,000 77,250 157,250 850,000 100,000 71,250 171,250 850,000 63,750 913,750 - Total Debt Outstanding Principal Payment Interest Payment Total Payment 1,220,000 1,190,000 1,160,000 30,000 65,450 95,450 1,130,000 30,000 69,600 99,600 1,090,000 40,000 73,450 113,450 1,030,000 60,000 81,750 141,750 950,000 80,000 77,250 157,250 850,000 100,000 71,250 171,250 850,000 63,750 913,750 - Figure 17.6
Tax Schedule The tax schedule is set up to estimate the yearly tax expenses going forward. These expenses are typically calculated by multiplying the tax rate to the earnings before taxes (EBT). A portion of this expense could be the actual taxes paid in cash and the remaining will be deferred. Figure 17.7 shows that 4% of the tax expenses are deferred (historical estimate) and the other 96% is paid in cash. The tax rate used in this case is 40%. The deferred tax is added to the net income in the cash flow statement, like the depreciation expense. Projections Building the Financial Model Celerity Technogy Inc. ("CTI") TAX SCHEDULE BASE CASE HISTORICAL PROJECTED Year -1 Year 0 Year 1 354,422 40.00% 141,769 5,671 136,098 Year 2 397,676 40.00% 159,070 6,363 152,708 Year 3 432,399 40.00% 172,960 6,918 166,041 Year 4 456,152 40.00% 182,461 7,298 175,163 Year 5 487,128 40.00% 194,851 7,794 187,057 Year 6 521,074 40.00% 208,430 8,337 200,092 Year 7 558,088 40.00% 223,235 8,929 214,306 EBT Tax Rate Tax Expenses Tax Deffered Tax Paid (Cash) Tax Deferred as % of Taxes 4.00% 4.00% 4.00% 4.00% 4.00% 4.00% 4.00% Figure 17.7
Projections Building the Financial Model Balance Sheet Assumptions The balance sheet flows entirely as an output. The income statement builds the retained earnings (RE) found in the bottom of the balance sheet by adding the net income to last year s income, and the cash flow statement builds the cash (C) found on the top of the balance sheet by adding the free cash flow to last year s cash. All the balance sheet items in between the cash and retained earnings are driven primarily by the cash flow statement activities. Other balance sheet items such as other intangible and tangible long-term assets, as well as other liabilities, are projected based on either set asset schedules or as percentage of revenues. In later chapters we will discuss these assets such as goodwill that are generated based on new transactions involving the acquisition of the company or initial public offering. The example used, Celerity Technology Inc. does not show any other assets or liabilities now. In later chapters, we will examine the generation of goodwill and other intangibles based on an assumed leveraged buyout (LBO) or an acquisition of the company by another strategic
Celerity Technogy Inc. ("CTI") SUMMARY OF RESULTS BASE CASE HISTORICAL PROJECTED Year -1 960,000 Year 0 1,110,000 15.6% Year 1 1,228,140 10.6% Year 2 1,344,200 Year 3 1,442,919 Year 4 1,529,268 Year 5 1,605,161 Year 6 1,685,184 Year 7 1,769,595 Revenues Revenue Growth 9.5% 7.3% 6.0% 5.0% 5.0% 5.0% The Finished Product: Base Case Spreadsheet: Balance Sheet, Income, and Cash Flow Statements EBITDA EBITDA Margin 385,000 433,000 493,561 547,928 592,424 629,659 660,688 693,435 728,013 Interest Expense Tax Expense Working Capital Capex 65,450 77,973 (2,870) 138,304 69,600 87,489 4,548 151,374 73,450 95,128 3,869 162,491 81,750 100,354 3,384 172,215 77,250 107,168 2,974 180,761 71,250 114,636 3,136 189,773 63,750 122,779 3,308 199,279 Cash on Balance Sheet Total Debt Equity Ownerhip 45,000 1,220,000 1,746,000 65,800 1,190,000 1,919,800 200,853 1,160,000 2,196,249 351,583 1,130,000 2,506,437 510,992 1,090,000 2,843,708 661,361 1,030,000 3,199,507 809,384 950,000 3,579,467 956,452 850,000 3,985,904 374,567 4,421,213 - EBITDA / Interest (Coverage Ratio) Total Debt / EBITDA (Leveraged Ratio) Debt Capitalization 3.0x 3.1x 41.1% 3.6x 2.7x 38.3% 7.5x 2.4x 34.6% 7.9x 2.1x 31.1% 8.1x 1.8x 27.7% 7.7x 1.6x 24.4% 8.6x 1.4x 21.0% 9.7x 1.2x 17.6% 11.4x 0.0x 0.0% Figure 17.8
The Finished Product: Base Case Spreadsheet: Balance Sheet, Income, and Cash Flow Statements Celerity Technogy Inc. ("CTI") BALANCE SHEET BASE CASE HISTORICAL PROJECTED (000'S) Current Assets Cash Accounts Receivable Inventories Prepaid Expenses Total Current Assets Year -1 Year 0 Year 1 Year 2 Year 3 Year 4 Year 5 Year 6 Year 7 45,000 45,000 35,000 10,000 135,000 65,800 60,000 40,000 9,000 174,800 200,853 58,088 41,346 9,958 310,245 351,583 63,577 45,252 10,899 471,311 510,992 68,246 48,576 11,699 639,514 661,361 72,330 51,492 12,399 797,583 809,384 75,920 54,060 13,015 952,379 956,452 79,705 56,770 13,664 1,106,590 374,567 83,697 59,629 14,348 532,241 The balance sheet (figure 17.9) shows the base case results assuming the company continues to grow on all fronts, generating higher cash balances every year as retained earnings continue to grow. Property and Equipment Land Building Furniture & Equipment Total Gross P&E Less Accumulated Depreciaition Net P&E 2,500,000 450,000 50,000 3,000,000 (300,000) 2,700,000 2,500,000 550,000 75,000 3,125,000 (365,000) 2,760,000 3,263,304 (438,688) 2,824,616 3,414,678 (519,340) 2,895,338 3,577,169 (605,916) 2,971,253 3,749,384 (697,672) 3,051,712 3,930,145 (793,981) 3,136,164 4,119,918 (895,092) 3,224,826 4,319,197 (1,001,268) 3,317,929 Long-Term Investments 200,000 250,000 305,322 365,871 430,868 499,753 572,058 647,967 727,679 Total Assets 3,035,000 3,184,800 3,440,182 3,732,520 4,041,635 4,349,048 4,660,601 4,979,383 4,577,849 Liabilities and Owners Equity Current Liabilities Accounts Payable Accrued Income Taxes Accrued Expenses Current Portion of Long Term Debt Total Current Liabilities 35,000 12,000 10,000 20,000 77,000 40,000 10,000 8,000 10,000 68,000 41,346 11,064 8,851 61,262 45,252 12,110 9,688 67,050 48,576 12,999 10,399 71,975 51,492 13,777 11,022 76,291 54,060 14,461 11,569 80,090 56,770 15,182 12,145 84,097 88,325 59,629 15,942 12,754 - - - - - - - Long-Term Debt: 1,200,000 1,180,000 1,160,000 1,130,000 1,090,000 1,030,000 950,000 850,000 - Deferred Income Taxes Total Liabilties 12,000 1,289,000 17,000 1,265,000 22,671 1,243,933 29,034 1,226,083 35,952 1,197,927 43,250 1,149,541 51,044 1,081,134 59,382 993,478 68,311 156,636 Owners' Equity Common Stock Paid-in-Capital Retained Earnings Total Owners' Equity 1,000,000 746,000 1,746,000 1,000,000 25,000 894,800 1,919,800 1,000,000 25,000 1,171,249 2,196,249 1,000,000 25,000 1,481,437 2,506,437 1,000,000 25,000 1,818,708 2,843,708 1,000,000 25,000 2,174,507 3,199,507 1,000,000 25,000 2,554,467 3,579,467 1,000,000 25,000 2,960,904 3,985,904 1,000,000 25,000 3,396,213 4,421,213 - Total Liabilities & Owner's Equity Error Check 3,035,000 3,184,800 3,440,182 3,732,520 4,041,635 4,349,048 4,660,601 4,979,383 4,577,849 Figure 17.9 - - - - - - - - -
Celerity Technogy Inc. ("CTI") INCOME STATEMENT BASE CASE HISTORICAL PROJECTED (000'S) Revenues by Geography U.S. Europe Asia Total Revenue Total Revenue Growth Year -1 Year 0 Year 1 Year 2 Year 3 Year 4 Year 5 Year 6 Year 7 The Finished Product: Base Case Spreadsheet: Balance Sheet, Income, and Cash Flow Statements 800,000 120,000 40,000 960,000 920,000 140,000 50,000 1,110,000 15.6% 1,004,640 161,700 61,800 1,228,140 10.6% 1,086,594 182,495 75,112 1,344,200 1,152,767 201,182 88,970 1,442,919 1,211,126 215,506 102,636 1,529,268 1,266,232 225,312 113,618 1,605,161 1,323,846 235,563 125,775 1,685,184 1,384,081 246,282 139,233 1,769,595 9.5% 7.3% 6.0% 5.0% 5.0% 5.0% Cost of Revenues by Geography U.S. Europe Asia Total Cost of Revenue 293,000 39,000 13,000 345,000 350,000 50,000 20,000 420,000 381,763 56,595 24,720 463,078 412,906 63,873 30,045 506,823 438,051 70,414 35,588 544,053 460,228 75,427 41,054 576,709 481,168 78,859 45,447 605,474 503,061 82,447 50,310 635,818 525,951 86,199 55,693 667,842 Gross Profit Total Margin 615,000 690,000 62.2% 765,062 62.3% 837,377 62.3% 898,866 62.3% 952,558 62.3% 999,687 62.3% 1,049,365 62.3% 1,101,753 62.3% Operating Expenses Administrative & General Marketing Expenses Other Operating Expenses Total Operating Expenses 145,000 75,000 10,000 230,000 165,000 80,000 12,000 257,000 173,250 85,970 12,281 271,501 181,913 94,094 13,442 289,448 191,008 101,004 14,429 306,442 200,559 107,049 15,293 322,900 210,586 112,361 16,052 338,999 221,116 117,963 16,852 355,930 232,172 123,872 17,696 373,739 EBITDA EBITDA Margin % 385,000 40.1% 433,000 39.0% 493,561 40.2% 547,928 40.8% 592,424 41.1% 629,659 41.2% 660,688 41.2% 693,435 41.1% 728,013 41.1% The income statement (figure 17.10) shows a normalized growth and flat costs as percentage of revenue. Depreciation Amortization 60,000 65,000 73,688 80,652 86,575 91,756 96,310 101,111 106,176 - - - - - - - - - EBIT 325,000 368,000 419,872 467,276 505,849 537,902 564,378 592,324 621,838 EBITA Margin % 33.9% 33.2% 34.2% 34.8% 35.1% 35.2% 35.2% 35.1% 35.1% Total Interest Expense EBT Taxes Net Income 65,450 354,422 77,973 276,449 69,600 397,676 87,489 310,187 73,450 432,399 95,128 337,271 81,750 456,152 100,354 355,799 77,250 487,128 107,168 379,960 71,250 521,074 114,636 406,438 63,750 558,088 122,779 435,308 22.0% Figure 17.10
The Finished Product: Base Case Spreadsheet: Balance Sheet, Income, and Cash Flow Statements Celerity Technogy Inc. ("CTI") CASH FLOW STATEMENT BASE CASE PROJECTED (000'S) Year 0 Year 1 Year 2 Year 3 Year 4 Year 5 Year 6 Year 7 Net Income Plus Depreciation Plus Deffered Taxes Cash Income 148,800 65,000 5,000 218,800 276,449 73,688 5,671 355,808 310,187 80,652 6,363 397,202 337,271 86,575 6,918 430,765 355,799 91,756 7,298 454,853 379,960 96,310 7,794 484,064 406,438 101,111 8,337 515,886 435,308 106,176 8,929 550,414 The cash flow statement (figure 17.11) shows the buildup of free cash flow resulting from continuous growth of the income statement. The base case assumes working capital and investment activities are in line with the revenue growth. The financing activities are based on the debt schedule obligations including interest payments calculated on an assumed increase in floating rate (LIBOR) and set scheduled principal payments. Working Capital Activities Change in Accounts Receivable Change in Inventory Change in Prepaid Expenses Change in Accounts Payable Change in Accrued Income Taxes Change in Accrued Expenses Total Change in Working Capital (15,000) (5,000) 1,000 5,000 (2,000) (2,000) (18,000) 1,912 (1,346) (958) 1,346 1,064 2,870 (5,489) (3,906) (941) 3,906 1,046 (4,548) (4,669) (3,324) (800) 3,324 (3,869) (4,084) (2,916) (700) 2,916 (3,384) (3,590) (2,568) (615) 2,568 (2,974) (3,785) (2,709) (649) 2,709 (3,136) (3,992) (2,859) (684) 2,859 760 608 (3,308) 889 711 778 622 684 547 721 577 851 836 Operating Cash Flow (OCF) 200,800 358,679 392,654 426,896 451,469 481,089 512,750 547,106 Investment Activities Capital Expenditures Investments (Change) Total Financing Activities (125,000) (50,000) (175,000) (138,304) (55,322) (193,626) (151,374) (60,550) (211,923) (162,491) (64,996) (227,487) (172,215) (68,886) (241,101) (180,761) (72,305) (253,066) (189,773) (75,909) (265,682) (199,279) (79,711) (278,990) Cash Available Before Financing Activities 25,800 165,053 180,730 199,409 210,369 228,023 247,068 268,115 Financing Activities ST Debt Payments LT Debt Payments Equity Contribution Total Financing Activities (10,000) (20,000) 25,000 (5,000) (10,000) (20,000) (30,000) - (40,000) - (60,000) - (80,000) - (100,000) - (850,000) - (30,000) (30,000) (40,000) (60,000) (80,000) (100,000) (850,000) Free Cash Flow 20,800 135,053 150,730 159,409 150,369 148,023 147,068 (581,885) Beginning Cash 45,000 65,800 200,853 351,583 510,992 661,361 809,384 956,452 Ending Cash 65,800 200,853 351,583 510,992 661,361 809,384 956,452 374,567 Figure 17.11
Celerity Technogy Inc. ("CTI") FINANCIAL RATIOS BASE CASE HISTORICAL PROJECTED Year -1 Year 0 Year 1 Year 2 Year 3 Year 4 Year 5 Year 6 Year 7 The Finished Product: Base Case Spreadsheet: Balance Sheet, Income, and Cash Flow Statements Liquidity Ratios Current Ratio Quick ratio Accounts Receivable Turnover (ART) Accounts Receivable Days 1.8x 1.2x 2.6x 1.9x 21.1x 17.3x 5.1x 4.2x 20.8x 17.5x 7.0x 6.2x 22.1x 16.5x 8.9x 8.0x 21.9x 16.7x 10.5x 9.6x 21.8x 16.8x 11.9x 11.1x 21.7x 16.9x 13.2x 12.3x 21.7x 16.9x 6.0x 5.2x 21.7x 16.9x Solvency Ratios LTD / Total Capitalization EBITDA / Interest (Coverage Ratio) LTD / EBITDA (Leverage Ratio) Altma's Z-score (used Book Value of Equity) Financial Ratios 40.7% 38.1% 3.0x 3.1x 2.2x 34.6% 31.1% 27.7% 24.4% 21.0% 17.6% 7.5x 7.9x 8.1x 2.4x 2.1x 1.8x 2.4x 2.7x 3.0x 0.0% 11.4x 0.0x 18.9x 3.6x 2.7x 2.7x 7.7x 1.6x 3.3x 8.6x 1.4x 3.7x 9.7x 1.2x 4.2x Activity Ratios / Operating Ratios Inventory Ratio (IR) Inventory Ratio - Days 11.2x 32.6 11.4x 32.1 11.7x 31.2 11.6x 31.5 11.5x 31.7 11.5x 31.8 11.5x 31.8 11.5x 31.8 Profitability Ratios Gross Margin EBITDA Margin Return on Assets (ROA) Return on Equity (ROE) 64.1% 62.2% 40.1% 39.0% 62.3% 62.3% 62.3% 62.3% 62.3% 62.3% 62.3% 40.2% 40.8% 41.1% 41.2% 41.2% 41.1% 41.1% 8.3% 8.6% 8.7% 8.5% 13.4% 13.2% 12.6% 11.8% 11.2% 10.7% 10.4% 4.8% 8.1% 8.4% 8.4% 9.1% Figure 17.12
Building the What-if Scenario Cases The what-if scenario analysis could include a downside case, an upside case, a break-even case, or any other sensitivity case customized for the analyst that challenges the base case. The equity analyst could run the upside case including potential cost savings or enhanced revenue assumptions resulting from a new product launch or a significant price increase or an acquisition. The debt analyst could run a downside case measuring how resistant the company is if revenue declines and/or cost increases. The management could run a break-even case scenario to measure how low the revenue can go so a few of the obligations such as short-term and long-term debt services are not met.
Building the What-if Scenario Cases Celerity Technogy Inc. ("CTI") REVENUE ASSUMPTIONS DOWNSIDE CASE HISTORICAL PROJECTED Year -1 Year 0 Year 1 Year 2 Year 3 Year 4 Year 5 Year 6 Year 7 Revenues by Geography Volume Growth U.S. Europe Asia Total Volume Growth 7.50% 10.87% 21.95% 15.63% 2.00% 5.00% 10.00% 10.64% -1.00% -2.00% 3.00% 9.45% 1.00% 2.00% 5.00% 7.34% 2.00% 2.00% 5.00% 5.98% 2.00% 2.00% 5.00% 4.96% 2.00% 2.00% 5.00% 4.99% 2.00% 2.00% 5.00% 5.01% Revenue drivers: For example, the downside case (figure 17.13) for Celerity Technology Inc. shows lower revenue growth assumptions, perhaps to illustrate a potential recession that might occur in year 2, slower growth expectations in year 1, and very slow recovery post-recession years. Volume Sold (000's Units) U.S. Europe Asia Total Volume 16,000 2,300 820 19,120 17,200 2,550 1,000 20,750 17,544 2,678 1,100 21,322 17,369 2,624 1,133 21,126 17,542 2,676 1,190 21,408 17,893 2,730 1,249 21,872 18,251 2,785 1,312 22,347 18,616 2,840 1,377 22,833 18,988 2,897 1,446 23,331 Price Increase U.S. Europe Asia Total Price Increase 6.98% 5.23% 2.50% 1.00% 2.00% 2.00% 7.68% 10.47% 1.00% 2.00% 2.00% 1.00% 3.00% 2.00% 5.93% 2.00% 3.00% 2.00% 3.74% 2.00% 2.50% 2.50% 2.73% 2.00% 2.50% 2.50% 2.75% 2.00% 2.50% 2.50% 2.77% Sales Price per Unit ($) U.S. Europe Asia Average Price 50.00 $ 52.17 $ 48.78 $ 50.21 $ 53.49 $ 54.90 $ 50.00 $ 53.49 $ 54.02 $ 56.00 $ 51.00 $ 57.60 $ 54.56 $ 57.12 $ 52.02 $ 63.63 $ 55.11 $ 58.83 $ 53.06 $ 67.40 $ 56.21 $ 60.60 $ 54.12 $ 69.92 $ 57.34 $ 62.11 $ 55.47 $ 71.83 $ 58.48 $ 63.67 $ 56.86 $ 73.80 $ 59.65 $ 65.26 $ 58.28 $ 75.85 $ The lower revenue growth and declines are adjusted by region including volume and price. Revenue Growth U.S. Europe Asia Total Price Increase 15.00% 16.67% 25.00% 15.63% 9.20% 15.50% 12.86% 10.24% 23.60% 21.54% 18.45% 15.36% 10.70% 10.70% 10.70% 10.64% 9.45% 7.34% 5.98% 8.16% 6.09% 5.06% 7.12% 4.55% 4.55% 4.55% 4.55% 4.55% 4.55% 4.96% 4.99% 5.01% Figure 17.13
Celerity Technogy Inc. ("CTI") Building the What-if Scenario Cases INCOME STATEMENT COST ASSUMPTIONS DOWNSIDE CASE HISTORICAL PROJECTED Year -1 Year 0 Year 1 Year 2 Year 3 Year 4 Year 5 Year 6 Year 7 Cost of Revenues as % of Revenue by Geography U.S. Europe Asia Total Cost of Rev. as % of Total Revenue 36.63% 38.04% 32.50% 35.71% 32.50% 40.00% 35.94% 37.84% 40.00% 39.00% 39.00% 39.00% 39.00% 39.00% 39.00% 36.00% 36.00% 36.00% 36.00% 36.00% 36.00% 36.00% 40.00% 40.00% 40.00% 40.00% 40.00% 40.00% 40.00% 37.71% 37.70% 37.71% 37.71% 37.72% 37.73% 37.74% Cost assumptions: This case will also assume an increase in costs on both the direct and indirect expenses (figure 17.14) resulting in lower margins, profit, and cash flow. Gross Margin by Geography U.S. Europe Asia Total Cost of Rev. as % of Total Revenue 63.38% 61.96% 67.50% 64.29% 67.50% 60.00% 64.06% 62.16% 60.00% 61.00% 61.00% 61.00% 61.00% 61.00% 61.00% 64.00% 64.00% 64.00% 64.00% 64.00% 64.00% 64.00% 60.00% 60.00% 60.00% 60.00% 60.00% 60.00% 60.00% 62.29% 62.30% 62.29% 62.29% 62.28% 62.27% 62.26% Operating Expenses Assumptions Administrative & General Increase % Marketing Expenses as % of Total Revenue Other Operating Expenses as % of Total Rev. Total Operating Expenses as % of Total Rev. 13.79% 5.00% 5.00% 5.00% 5.00% 5.00% 5.00% 5.00% 8.00% 8.00% 8.00% 8.00% 8.00% 8.00% 8.00% 1.00% 1.00% 1.00% 1.00% 1.00% 1.00% 1.00% 22.11% 21.53% 21.24% 21.11% 21.12% 21.12% 21.12% 7.81% 7.21% 1.04% 1.08% 23.96% 23.15% Depreciation Expense % of Total Revenue 6.25% 5.86% 6.00% 6.00% 6.00% 6.00% 6.00% 6.00% 6.00% Figure 17.14
Celerity Technogy Inc. ("CTI") Building the What-if Scenario Cases Working Capital Assumptions DOWNSIDE CASE HISTORICAL PROJECTED DOWNSIDE CASE Accounts Receivable Accounts Receivable Turnover Accounts Receivable Days Year -1 Year 0 Year 1 Year 2 Year 3 Year 4 Year 5 Year 6 Year 7 21x 21x 21x 21x 21x 21x 21x 21x 17.26 17.26 17.26 17.26 17.26 17.26 17.26 17.26 Inventory Inventory Turnover Inventory Days Working capital assumptions: 11x 11x 11x 11x 11x 11x 11x 11x 32.59 32.59 32.59 32.59 32.59 32.59 32.59 32.59 The working capital assumptions (figure 17.15) were kept at the same levels as the base case though there could be an argument that the company manages the receivables and payables differently in recession years as it is trying to squeeze more cash given the income declines. Prepaid Expenses Prepaid Expenses as % of Revene 0.81% 0.81% 0.81% 0.81% 0.81% 0.81% 0.81% 0.81% 0.81% Accounts Payable Accounts Payable Turnover Accounts Payable Days 11x 11x 11x 11x 11x 11x 11x 11x 32.59 32.59 32.59 32.59 32.59 32.59 32.59 32.59 Accrued Income Taxes Accrued Income Taxes as % of Revenues 1.25% 0.90% 0.90% 0.90% 0.90% 0.90% 0.90% 0.90% 0.90% Accrued Expenses Accrued Expenses as % of Revenues 1.04% 0.72% 0.72% 0.72% 0.72% 0.72% 0.72% 0.72% 0.72% Figure 17.15
Investment activities: The capital expenditures and annual investments are typically the first expenses that management is able to cut when facing recessionary pressures, lower revenues, and/or higher operating costs. Building the What-if Scenario Cases This downside case though (figure 16.16), takes a conservative approach by showing that capital expenditures and long-term investments as percentage of revenues remain the same as the base case. Celerity Technogy Inc. ("CTI") INVESTMENT ACTIVITY ASSUMPTIONS DOWNSIDE CASE HISTORICAL PROJECTED Year -1 Year 0 Year 1 Year 2 Year 3 Year 4 Year 5 Year 6 Year 7 Capital Expenditures Capital Expenditures as % of Revenue 11.26% 11.26% 11.26% 11.26% 11.26% 11.26% 11.26% 11.26% Long Term Investments Long Term Investments as % of Revenues 4.50% 4.50% 4.50% 4.50% 4.50% 4.50% 4.50% 4.50% Figure 17.16
Celerity Technogy Inc. ("CTI") BALANCE SHEET DOWNSIDE CASE HISTORICAL PROJECTED (000'S) Current Assets Cash Accounts Receivable Inventories Prepaid Expenses Total Current Assets Year -1 Year 0 Year 1 Year 2 Year 3 Year 4 Year 5 Year 6 Year 7 Building the What- if Scenario Cases - Deliverable 45,000 45,000 35,000 10,000 135,000 65,800 60,000 40,000 9,000 174,800 154,909 54,573 40,673 9,355 259,509 236,187 54,700 39,922 9,377 340,186 304,470 56,157 40,979 9,627 411,233 351,674 58,593 42,755 10,045 463,067 388,723 61,115 44,596 10,477 504,911 417,018 63,749 46,519 10,928 538,215 (292,013) 66,501 48,529 11,400 (165,583) Property and Equipment Land Building Furniture & Equipment Total Gross P&E Less Accumulated Depreciaition Net P&E 2,500,000 450,000 50,000 3,000,000 (300,000) 2,700,000 2,500,000 550,000 75,000 3,125,000 (365,000) 2,760,000 3,254,935 (434,229) 2,820,706 3,385,173 (503,620) 2,881,553 3,518,880 (574,859) 2,944,021 3,658,388 (649,189) 3,009,199 3,803,900 (726,718) 3,077,182 3,955,684 (807,588) 3,148,096 4,114,020 (891,950) 3,222,070 The downside case results shown in each core statement (balance sheet in figure 17.17, income statement in figure 17.18, and cash flow statement figure 17.19, are better captured in the ratio analysis. Long-Term Investments 200,000 250,000 301,974 354,069 407,552 463,355 521,560 582,274 645,608 Total Assets 3,035,000 3,184,800 3,382,189 3,575,808 3,762,806 3,935,621 4,103,653 4,268,584 3,702,095 Liabilities and Owners Equity Current Liabilities Accounts Payable Accrued Income Taxes Accrued Expenses Current Portion of Long Term Debt Total Current Liabilities 35,000 12,000 10,000 20,000 77,000 40,000 10,000 8,000 10,000 68,000 40,673 10,395 8,316 59,383 39,922 10,419 8,335 58,677 40,979 10,697 8,557 60,233 42,755 11,161 8,929 62,844 44,596 11,641 9,313 65,550 46,519 12,143 9,714 68,376 48,529 12,667 10,133 71,329 - - - - - - - Long-Term Debt: 1,200,000 1,180,000 1,160,000 1,130,000 1,090,000 1,030,000 950,000 850,000 - Deferred Income Taxes Total Liabilties 12,000 1,289,000 17,000 1,265,000 19,521 1,238,905 22,024 1,210,701 24,539 1,174,772 27,107 1,119,951 29,844 1,045,394 32,768 951,144 35,898 107,227 Owners' Equity Common Stock Paid-in-Capital Retained Earnings Total Owners' Equity 1,000,000 746,000 1,746,000 1,000,000 25,000 894,800 1,919,800 1,000,000 25,000 1,118,284 2,143,284 1,000,000 25,000 1,340,107 2,365,107 1,000,000 25,000 1,563,034 2,588,034 1,000,000 25,000 1,790,670 2,815,670 1,000,000 25,000 2,033,259 3,058,259 1,000,000 25,000 2,292,440 3,317,440 1,000,000 25,000 2,569,868 3,594,868 - Total Liabilities & Owner's Equity Error Check 3,035,000 3,184,800 3,382,189 3,575,808 3,762,806 3,935,621 4,103,653 4,268,584 3,702,095 Figure 17.17 - - - - - - - - -
Celerity Technogy Inc. ("CTI") Income Statement (000's) HISTORICAL PROJECTED Year -1 Year 0 Year 1 Year 2 Year 3 Year 4 Year 5 Year 6 Year 7 Revenues by Geography U.S. Europe Asia Total Revenue Total Revenue Growth 800,000 120,000 40,000 960,000 920,000 140,000 50,000 1,110,000 15.6% 947,784 149,940 56,100 1,153,824 947,689 149,880 58,939 1,156,508 966,738 157,464 63,123 1,187,325 1,005,794 165,432 67,605 1,238,831 1,046,428 172,959 72,760 1,292,147 1,088,704 180,828 78,308 1,347,840 1,132,687 189,056 84,279 1,406,022 3.9% 0.2% 2.7% 4.3% 4.3% 4.3% 4.3% Cost of Revenues by Geography U.S. Europe Asia Total Cost of Revenue 293,000 39,000 13,000 345,000 350,000 50,000 20,000 420,000 379,114 53,978 22,440 455,532 369,599 53,957 23,575 447,131 377,028 56,687 25,249 458,964 392,260 59,555 27,042 478,857 408,107 62,265 29,104 499,476 424,594 65,098 31,323 521,016 441,748 68,060 33,712 543,520 Building the What-if Scenario Cases - Deliverable Gross Profit Total Margin 615,000 690,000 62.2% 698,292 60.5% 709,377 61.3% 728,361 61.3% 759,974 61.3% 792,671 61.3% 826,824 61.3% 862,503 61.3% Operating Expenses Administrative & General Marketing Expenses Other Operating Expenses Total Operating Expenses 145,000 75,000 10,000 230,000 165,000 80,000 12,000 257,000 173,250 92,306 11,538 277,094 181,913 92,521 11,565 285,998 191,008 94,986 11,873 297,867 200,559 99,106 12,388 312,053 210,586 103,372 12,921 326,880 221,116 107,827 13,478 342,421 232,172 112,482 14,060 358,714 EBITDA EBITDA Margin % 385,000 40.1% 433,000 39.0% 421,198 36.5% 423,379 36.6% 430,494 36.3% 447,920 36.2% 465,791 36.0% 484,403 35.9% 503,789 35.8% Depreciation Amortization 60,000 65,000 69,229 69,390 71,240 74,330 77,529 80,870 84,361 - - - - - - - - - EBIT 325,000 368,000 351,968 353,988 359,254 373,590 388,262 403,532 419,428 EBITA Margin % 33.9% 33.2% 30.5% 30.6% 30.3% 30.2% 30.0% 29.9% 29.8% Total Interest Expense EBT Taxes Net Income 65,450 286,518 63,034 223,484 69,600 284,388 62,565 221,823 73,450 285,804 62,877 222,927 81,750 291,840 64,205 227,636 77,250 311,012 68,423 242,590 71,250 332,282 73,102 259,180 63,750 355,678 78,249 277,429 22.0% Figure 17.18
Celerity Technogy Inc. ("CTI") Cash Flow Statement (000's) PROJECTED DOWNSIDE CASE Year 0 Year 1 Year 2 Year 3 Year 4 Year 5 Year 6 Year 7 Net Income Plus Depreciation Plus Deffered Taxes Cash Income 148,800 65,000 5,000 218,800 223,484 69,229 2,521 295,235 221,823 69,390 2,503 293,716 222,927 71,240 2,515 296,682 227,636 74,330 2,568 304,534 242,590 77,529 2,737 322,855 259,180 80,870 2,924 342,975 277,429 84,361 3,130 364,920 Building the What-if Scenario Cases - Deliverable Working Capital Activities Change in Accounts Receivable Change in Inventory Change in Prepaid Expenses Change in Accounts Payable Change in Accrued Income Taxes Change in Accrued Expenses Total Change in Working Capital (15,000) (5,000) 1,000 5,000 (2,000) (2,000) (18,000) 5,427 (673) (355) 673 395 316 5,783 (127) 750 (22) (750) 24 19 (105) (1,458) (1,057) (250) 1,057 (1,208) (2,436) (1,776) (418) 1,776 (2,018) (2,522) (1,841) (432) 1,841 (2,089) (2,634) (1,923) (452) 1,923 (2,183) (2,752) (2,009) (472) 2,009 524 419 (2,280) 278 222 464 371 480 384 502 401 Operating Cash Flow (OCF) 200,800 301,018 293,611 295,474 302,515 320,766 340,792 362,640 Investment Activities Capital Expenditures Investments (Change) Total Financing Activities (125,000) (50,000) (175,000) (129,935) (51,974) (181,909) (130,237) (52,095) (182,332) (133,708) (53,483) (187,191) (139,508) (55,803) (195,311) (145,512) (58,205) (203,717) (151,784) (60,714) (212,497) (158,336) (63,334) (221,670) Cash Available Before Financing Activities 25,800 119,109 111,278 108,283 107,204 117,049 128,295 140,970 Financing Activities ST Debt Payments LT Debt Payments Equity Contribution Total Financing Activities (10,000) (20,000) 25,000 (5,000) (10,000) (20,000) (30,000) - (40,000) - (60,000) - (80,000) - (100,000) - (850,000) - (30,000) (30,000) (40,000) (60,000) (80,000) (100,000) (850,000) Free Cash Flow 20,800 89,109 81,278 68,283 47,204 37,049 28,295 (709,030) Beginning Cash 45,000 65,800 154,909 236,187 304,470 351,674 388,723 417,018 Ending Cash 65,800 154,909 236,187 304,470 351,674 388,723 417,018 (292,013) Figure 17.19
Celerity Technogy Inc. ("CTI") Financial Ratios HISTORICAL PROJECTED Building the What-if Scenario Cases - Deliverable Year -1 Year 0 Year 1 Year 2 Year 3 Year 4 Year 5 Year 6 Year 7 Liquidity Ratios Current Ratio Quick ratio Accounts Receivable Turnover (ART) Accounts Receivable Days 1.8x 1.2x 2.6x 1.9x 21.1x 17.3x 4.4x 3.5x 20.8x 17.5x 5.8x 5.0x 22.1x 16.5x 6.8x 6.0x 21.9x 16.7x 7.4x 6.5x 21.8x 16.8x 7.7x 6.9x 21.7x 16.9x 7.9x 7.0x 21.7x 16.9x -2.3x -3.2x 21.7x 16.9x Solvency Ratios LTD / Total Capitalization EBITDA / Interest (Coverage Ratio) LTD / EBITDA (Leverage Ratio) Altma's Z-score (used Book Value of Equity) 40.7% 38.1% 3.0x 3.1x 2.2x 34.6% 31.1% 27.7% 24.4% 21.0% 17.6% 6.4x 6.1x 5.9x 2.8x 2.7x 2.5x 2.4x 2.7x 3.0x 0.0% 7.9x 0.0x 18.9x 3.6x 2.7x 2.7x 5.5x 2.3x 3.3x 6.0x 2.0x 3.7x 6.8x 1.8x 4.2x Activity Ratios / Operating Ratios Inventory Ratio (IR) Inventory Ratio - Days 11.2x 32.6 11.4x 32.1 11.7x 31.2 11.6x 31.5 11.5x 31.7 11.5x 31.8 11.5x 31.8 11.5x 31.8 Profitability Ratios Gross Margin EBITDA Margin Return on Assets (ROA) Return on Equity (ROE) 64.1% 62.2% 40.1% 39.0% 62.3% 62.3% 62.3% 62.3% 62.3% 62.3% 62.3% 40.2% 40.8% 41.1% 41.2% 41.2% 41.1% 41.1% 8.3% 8.6% 8.7% 8.5% 13.4% 13.2% 12.6% 11.8% 11.2% 10.7% 10.4% 4.8% 8.1% 8.4% 8.4% 9.1% Figure 17.20


