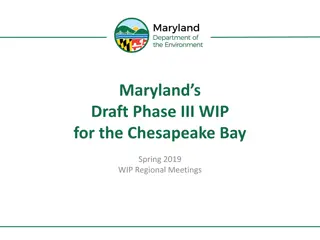
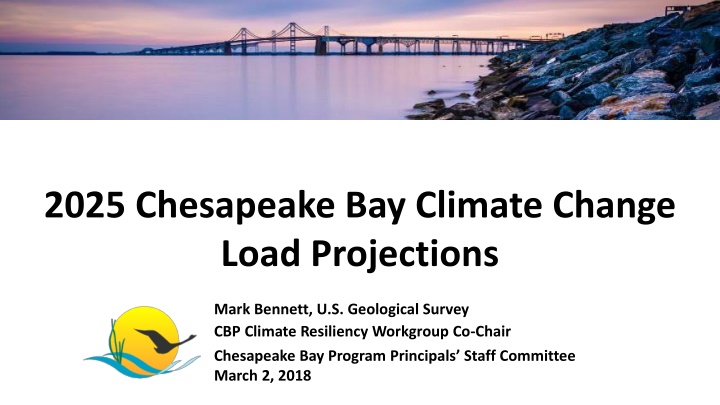
Chesapeake Bay Climate Change Load Projections for 2025
The document discusses climate change projections for the Chesapeake Bay in 2025, focusing on factors like sea level rise, temperature increase, and precipitation change. It outlines proposed policy decisions, addressing uncertainties in climate change impacts on water quality and the need to incorporate changing climate conditions into watershed plans. The report emphasizes using reliable projections to limit uncertainty and highlights the balance of different effects on the bay's ecosystem.

Download Presentation

Please find below an Image/Link to download the presentation.
The content on the website is provided AS IS for your information and personal use only. It may not be sold, licensed, or shared on other websites without obtaining consent from the author.If you encounter any issues during the download, it is possible that the publisher has removed the file from their server.
You are allowed to download the files provided on this website for personal or commercial use, subject to the condition that they are used lawfully. All files are the property of their respective owners.
The content on the website is provided AS IS for your information and personal use only. It may not be sold, licensed, or shared on other websites without obtaining consent from the author.
E N D
Presentation Transcript
2025 Chesapeake Bay Climate Change Load Projections Mark Bennett, U.S. Geological Survey CBP Climate Resiliency Workgroup Co-Chair Chesapeake Bay Program Principals Staff Committee March 2, 2018
2 Today s Requested Policy Decisions 1) Approve the proposed next steps and overall schedule for addressing uncertainty in our understanding of climate change impacts on Chesapeake Bay water quality. 2) Agree to use the nutrient and sediment load reductions presented in December 2017 as the starting point for proceeding forward the with proposed Partnership multi-year schedule for factoring changing climate conditions into the jurisdictions Phase III Watershed Implementation Plans.
To Limit Uncertainty The Partnership used STAC recommended projections for 2025 that have a high level of confidence1 Selection of projections for sea level rise and precipitation change were based on past records of observed climatic and resultant river flow conditions Downscaled temperature projections for 2025 are closely aligned with observed trends 1. CBP Scientific and Technical Advisory Committee. 2016. The Development of Climate Projections for Use in Chesapeake Bay Program Assessments. March 2016 Workshop. 4
Major Climate Variables: 2025 Projections Extrapolation of NOAA observed sea level trends (Swells Point, VA) 17 centimeters Relative Sea Level Rise Downscaled climate projections (RCP 4.5) 1.98 F / 1.1 C Increase Temperature Increase Observed trends in 88-years of annual PRISM[1] data 3.1% Increase Precipitation Change
Accounting for Changing Conditions Cumulative Assessment of Bay Low Dissolved Oxygen Impacts 6
In the Summer of 2017 Our Message was Climate Change Effects by 2025 were Projected to be Minimal as the Different Effects were Largely Counteracting Each Other
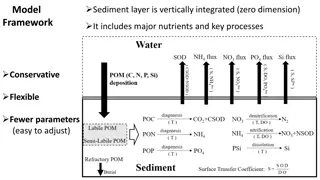
Summer 2017 Assessment: Deep Water Dissolved Oxygen in Balance Watershed Loads Increase Sea Level Rise Increases Water Temperature in Bay Increases Decreased Oxygen In Deep Waters of the Bay Increased Oxygen In Deep Waters of the Bay 8
So What Changed Between the Summer 2017 Assessment of Projected Climate Change Impacts and what was Presented to the PSC at the December 19-20 Meeting?
Estimated Sea Level Rise Decreased Partnership originally used a predicted sea level rise of 30 centimeters (1 foot) between the 1990s and 2025 Better scientific understanding brought forth by Partners NOAA released new sea level rise projections for the Chesapeake Bay VIMS also provided updated sea level rise projections Based on new science, the CBP Climate Resiliency Workgroup recommended using a projection of 17 centimeters Consistent with long term trends at the Sewells Point, VA tide gauge at Bay mouth Result: less influx of colder, oxygen-rich ocean water causing less ventilation of low dissolved oxygen waters in the deepest portions of the Bay 10
Climate Change Effects on Loading of Different Types of Nutrients Better Understood Total nitrogen and phosphorus are expected to stay about the same Dissolved nitrate and phosphate have a strong effect on dissolved oxygen and increase with climate change Ammonia decreased as a percentage, but the absolute amount is small Organic nutrients decrease, but they have a weak effect on dissolved oxygen
December 2017 Assessment: Deep Water Dissolved Oxygen Not in Balance Sea Level Rise Increases Watershed Loads Increase Water Temperature in Bay Increases Decreased Oxygen In Deep Waters of the Bay Increased Oxygen In Deep Waters of the Bay 12
Nutrient Load Reductions Needed to Account for Reduced Oxygen Due to Climate Change We can choose to reduce nitrogen, phosphorus, or both Since most BMPs apply to both nutrients, a balanced approach is more efficient than just focusing on one or the other Analysis performed in December of 2017 indicated that raising the level of effort for all jurisdictions using the approved planning target method resulted in an estimate of 9.1 million pounds of nitrogen and 490,000 pounds of phosphorus basin-wide 13
Climate Change Loads: Nitrogen 1985 Baseline 2013 Progress Climate Change Phase III Planning Target Jurisdiction NY PA MD WV DC DE VA 18.71 122.41 83.56 8.73 6.48 6.97 84.29 331.15 15.44 99.28 55.89 8.06 1.75 6.59 61.53 248.54 0.400 (3.8%) 4.135 (5.7%) 2.194 (4.8%) 0.236 (3.7%) 0.006 (0.3%) 0.397 (8.5%) 1.722 (3.1%) 9.09 (4.6%) 11.59 73.18 45.30 8.35 2.43 4.59 55.82 201.25 Basinwide *Units: millions of pounds
Climate Change Loads: Phosphorus Jurisdiction 1985 Baseline 2013 Progress Climate Change Phase III Planning Target NY PA MD WV DC DE VA 1.198 6.282 7.495 0.902 0.090 0.225 14.244 30.44 0.710 3.749 3.942 0.617 0.062 0.116 6.751 15.95 0.014 (2.9%) 0.141 (4.7%) 0.114 (3.2%) 0.019 (3.9%) 0.001 (0.8%) 0.006 (5.1%) 0.193 (3.0%) 0.489 (3.4%) 0.606 3.073 3.604 0.456 0.130 0.120 6.186 14.173 Basinwide *Units: millions of pounds
December 19-20 PSC Policy Decisions 1. Incorporate Climate Change in the Phase III WIPs Include a narrative strategy in the Phase III WIPs that describes the jurisdictions current action plans and strategies to address climate change, as well as the jurisdiction-specific nutrient and sediment pollution loadings due to 2025 climate change conditions, while incorporating local priorities and actions to address climate change impacts. 2. Understand the Science Address the uncertainty by documenting the current understanding of the science and identifying research gaps and needs. 3. Incorporate into Milestones Starting with the 2022-2023 milestones, determine how climate change will impact the BMPs included in the WIPs and address these vulnerabilities in the two-year milestones. 16
Understanding the Science: Proposed Next Steps 2020 2021 2018 2019 STAC Workshop to examine current results, assess lessons- learned and recommend next steps. Following the direction of the PSC, the Modeling and Climate Resiliency Workgroups, working with other key Chesapeake Bay Program groups, will develop and implement a complete and fully operational climate change modeling and assessment system in 2019. In 2020, the CBP partners will complete a technical review and process for approval of the new refined climate change modeling and assessment system as well as the scientific and technical findings from its management applications. In 2021, the policy implications for including targets adjusted for the influence of climate change into the 2022- 2023 milestones will be considered by the Partnership. Climate Resiliency Workgroup will incorporate actions in its 2018-2020 workplan to develop a better understanding of BMP responses, including new or other emerging BMPs, to climate change conditions. By the close of 2021, the refined findings on climate change will be implemented into the jurisdictions 2022-2023 milestones. 17
18 Today s Requested Policy Decisions First: Approval of the proposed next steps and overall schedule for addressing uncertainty by documenting the current understanding of the science and identifying research gaps and needs.
19 Today s Requested Policy Decisions Second: Agreement to use the nutrient and sediment load reductions presented in December 2017 needed to address projected climate change impacts on Bay water quality by 2025 as the starting point for proceeding forward the with proposed Partnership multi-year schedule for factoring changing climate conditions into the jurisdictions Phase III Watershed Implementation Plans.
20 Today s Requested Policy Decisions Third: Agreement on New York s proposed revised Factoring Climate Change Considerations into the Phase III Watershed Implementation Plans language: 1. Incorporate Climate Change in the Phase III WIPs Include a narrative strategy in the Phase III WIPs that describes the state and local jurisdictions current action plans and strategies to address climate change and commit to adopting climate change allocations by 2021, employing the climate change model and other relevant local information.
21 Today s Requested Policy Decisions 2. Understand the Science Continue to sharpen the understanding of the science, impacts of climate change, and identify research gaps and needs. Develop an estimate of pollutant load changes (nitrogen, phosphorus, and sediment) due to 2025 climate change conditions. Develop a better understanding of BMP responses, including new, enhanced and resilient BMPs, to better address climate change conditions such as increased storm intensity. In 2021, the Partnership will consider results of updated methods, techniques, and studies and determine estimated loads due to climate change for each jurisdiction. In 2021 jurisdictions will account for additional nutrient and sediment pollutant loads due to 2025 climate change conditions in a Phase III WIP addendum and/or 2-year milestones beginning in 2022.
22 Today s Requested Policy Decisions 3. Incorporate into Milestones Starting with the 2022-2023 milestones, the Partnership will determine how climate change will impact the BMPs included in the WIPs and address these vulnerabilities in the two-year milestones.