Probability Distributions Using Dice Rolling
Inferential Statistics
IMGD 2905
Overview
•
Use statistics to infer population parameters
Outline
•
Overview
(
done
)
•
Foundation
(
next
)
•
Inferring Population Parameters
•
Hypothesis Testing
Groupwork
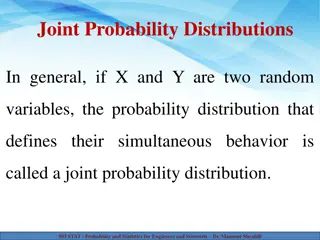
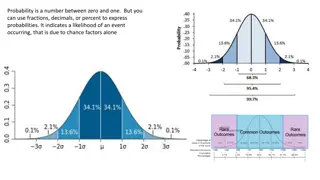
Remember,
probability distribution
shows possible
outcomes on x-axis and probability of each on y-axis.
1.
Describe the probability distribution of 1 d6?
2.
Describe the probability distribution of 2 d6?
3.
Describe the probability distribution of 3 d6?
Icebreaker, Groupwork, Questions
https://web.cs.wpi.edu/~imgd2905/d23/groupwork/6-prob-dist/handout.html
https://academo.org/demos/dice-roll-statistics/
Dice Rolling (1 of 4)
•
Have 1d6, sample (i.e., roll 1 die)
•
What is probability distribution of values?
Dice Rolling (1 of 4)
•
Have 1d6, sample (i.e., roll 1 die)
•
What is probability distribution of values?
http://www.investopedia.com/articles/06/probabilitydistribution.asp
“Square“
distribution
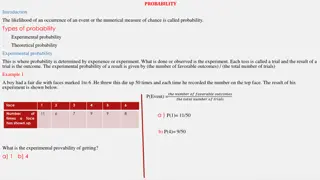
Dice Rolling (2 of 4)
•
Have 1d6, sample twice and sum (i.e., roll 2
dice)
•
What is probability distribution of values?
Dice Rolling (2 of 4)
•
Have 1d6, sample twice and sum (i.e., roll 2
dice)
•
What is probability distribution of values?
http://www.investopedia.com/articles/06/probabilitydistribution.asp
“Triangle“
distribution
Dice Rolling (3 of 4)
•
Have 1d6, sample thrice and sum (i.e., roll 3
dice)
•
What is probability distribution of values?
Dice Rolling (3 of 4)
•
Have 1d6, sample thrice and sum (i.e., roll 3
dice)
•
What is probability distribution of values?
http://www.investopedia.com/articles/06/probabilitydistribution.asp
What’s happening
to the shape?
Dice Rolling (3 of 4)
•
Have 1d6, sample thrice and sum (i.e., roll 3
dice)
•
What is probability distribution of values?
What’s happening to
the shape?
Dice Rolling (4 of 4)
•
Same holds for general experiments with dice (i.e.,
observing
sample sum
and
mean
of dice rolls)
Ok, neat – for “square” distributions (e.g., d6).
But what about experiments with
other distributions
?
Resulting
sum
/
mean
follows a normal
distribution
Even though base
distribution is
uniform!
Sampling
Distributions
•
With “large enough”
sample size,
sum
/
mean
looks “bell-
shaped”
Normal
!
•
How many is large
enough?
–
30
(15 if symmetric
distribution)
•
Central Limit Theorem
–
Sum of independent
variables tends
towards
Normal
distribution
Sampling
Distributions
•
With “large enough”
sample size,
sum
/
mean
looks “bell-
shaped”
Normal
!
•
How many is large
enough?
–
30
(15 if symmetric
distribution)
•
Central Limit Theorem
–
Sum of independent
variables tends
towards
Normal
distribution
Sampling
Distributions
•
With “large enough”
sample size,
sum
/
mean
looks “bell-
shaped”
Normal
!
•
How many is large
enough?
–
30
(15 if symmetric
distribution)
•
Central Limit Theorem
–
Sum of independent
variables tends
towards
Normal
distribution
Sampling
Distributions
•
With “large enough”
sample size,
sum
/
mean
looks “bell-
shaped”
Normal
!
•
How many is large
enough?
–
30
(15 if symmetric
distribution)
•
Central Limit Theorem
–
Sum of independent
variables tends
towards
Normal
distribution
Sampling
Distributions
•
With “large enough”
sample size,
sum
/
mean
looks “bell-
shaped”
Normal
!
•
How many is large
enough?
–
30
(15 if symmetric
distribution)
•
Central Limit Theorem
–
Sum of independent
variables tends
towards
Normal
distribution
Sampling
Distributions
•
With “large enough”
sample size,
sum
/
mean
looks “bell-
shaped”
Normal
!
•
How many is large
enough?
–
30
(15 if symmetric
distribution)
•
Central Limit Theorem
–
Sum of independent
variables tends
towards
Normal
distribution
Sampling
Distributions
•
With “large enough”
sample size,
sum
/
mean
looks “bell-
shaped”
Normal
!
•
How many is large
enough?
–
30
(15 if symmetric
distribution)
•
Central Limit Theorem
–
Sum of independent
variables tends
towards
Normal
distribution
Sampling
Distributions
•
With “large enough”
sample size,
sum
/
mean
looks “bell-
shaped”
Normal
!
•
How many is large
enough?
–
30
(15 if symmetric
distribution)
•
Central Limit Theorem
–
Sum
/
mean
of
independent variables
tends towards
Normal
distribution
Why do we care about
sample means
following
Normal distribution
?
•
What if we had only a
sample mean
and no
measure of spread
–
e.g., mean score is 3
•
What can we say about
population mean
?
–
Not a whole lot!
–
Yes,
population mean
could be 6. But could be
0. How likely are each?
No idea!
Why do we care about
sample means
following
Normal distribution
?
•
Remember this?
Allows us to predict
range
to
bound
population mean
(see next slide)
http://www.six-sigma-material.com/images/PopSamples.GIF
With
mean
and
standard deviation
Why do we care about
sample means
following
Normal distribution
?
Actual
population mean
(probably) in this range!
Outline
•
Overview
(
done
)
•
Foundation
(
done
)
•
Inferring Population Parameters
(
next
)
•
Hypothesis Testing
Estimating Population Mean
•
Underlying data follows
uniform probability
distribution (d6)
–
But assume population
mean unknown
Sample
Sample Mean
1
d6
4.0
2
d6 (4 + 2) / 2 =
3.0
3
d6 (1 + 6 + 2) / 3 =
2.3
4
d6 (4 + 4 + 2 + 3) / 4 =
3.3
Q:
How do we estimate
the population mean?
(Example)
Estimating Population Mean
Q: What happens as
sample size
increases?
Q: How big a sample
do we need?
Depends upon how
much varies
Values that are not
the mean are an
“error”
sampling
error
https://demonstrations.wolfram.com/La
wOfLargeNumbersDiceRollingExample/
Sample size
50
Estimating Population Mean
Q: What happens as
sample size
increases?
Q: How big a sample
do we need?
Depends upon how
much varies
Values that are not
the mean contribute
to “error”
sampling error
https://demonstrations.wolfram.com/La
wOfLargeNumbersDiceRollingExample/
Sampling Error
•
Error from estimating
population
parameters from
sample
statistics is
sampling error
•
Exact error often cannot be known (do not
know population parameters)
•
But
size
of error based on:
–
Variation in population
(
σ
)
itself – more
variation, more sample statistic variation (
s
)
–
Sample size (N)
– larger sample, lower error
•
Q: Why can’t we just make sample size super large
?
•
How much does it vary?
Standard error
Standard Error
•
Amount
sample means
will
vary from experiment to
experiment of same size
–
Standard deviation of the
sample means
•
Also, likelihood that sample
statistic is near population
parameter
So what? Reason about population mean
e.g.,
95% confident
that sample mean is
within
~ 2 SE’s
(where does this come from?)
•
What does the size of the
standard error depend
upon? (Hint: see formula
above)
Standard Error
•
Amount
sample means
will
vary from experiment to
experiment of same size
–
Standard deviation of the
sample means
•
Also, likelihood that sample
statistic is near population
parameter
So what? Reason about population mean
e.g.,
95% confident
that sample mean is
within
~ 2 SE’s
(where does this come from?)
Standard Error (2 of 2)
http://www.biostathandbook.com/standarderror.html
standard error, 100 experiments, N=3
If
N = 20
:
What will happen to x’s?
What will happen to dots?
If
N=20
:
What will happen to means?
What will happen to bars?
How many will cross the blue line?
Groupwork
1.
How many of the bars intersect the blue?
2.
What do graphs look like N = 20?
3.
Now, how many bars intersect?
•
Standard Error
https://web.cs.wpi.edu/~imgd2905/d23/groupwork/7-std-
error/handout.html
standard error, 100 experiments, N=3
Standard Error (2 of 2)
http://www.biostathandbook.com/standarderror.html
standard error, 100 experiments, N=3
If
N = 20
:
What will happen to x’s?
What will happen to dots?
If
N=20
:
What will happen to means?
What will happen to bars?
How many will cross the blue line?
Standard Error (2 of 2)
http://www.biostathandbook.com/standarderror.html
standard error, 100 experiments, N=3
standard error, 100 experiments,
N=20
Estimate population parameter
confidence interval
How many cross the blue line?
Confidence Interval
•
Range of values with specific certainty that population
parameter is within
–
e.g.,
90%
confidence interval for mean
League of Legends
match duration: [
28.5
minutes,
32.5
minutes]
•
Have
sample
of durations
•
Compute interval containing
mean
population
duration (
)
(with
90%
confidence)
•
In general:
probability of
in interval [
c
1
,
c
2
]
with
A
confidence
Mean:
30.5
Confidence Interval for Mean
•
Probability of
in interval
[c
1
,c
2
]
–
P(c
1
<
<
c
2
)
= 1-
[c1, c2] is
confidence interval
is
significance level
100(1-
) is
confidence level
•
Typically want
small so
confidence level
90%
,
95%
or
99%
(more on
effect later)
•
Say,
= 0.1. Could do
k
experiments (size
n
), find
sample means, sort
–
Graph distribution
•
Interval from distribution:
–
Lower bound:
5%
–
Upper bound:
95%
90%
confidence interval
So, do we have to do
k
experiments, each of size
n
?!
Confidence Interval Estimate
e.g., mean 30.5
t
x SE = 2
30.5 - 2 = 28.5
30.5 + 2 = 32.5
[
28.5
,
32.5
]
•
Ok, what is
t
distribution?
–
Function, parameterized
by
and
n
t
distribution
•
Looks like standard normal, but bit “squashed”
•
Gets more less squashed as
n
gets larger
http://ci.columbia.edu/ci/premba_test/c0331/images/s7/6317178747.gif
aka
student’s
t
distribution
(“student”
was anonymous name used when
published by William Gosset)
•
Note, can use
standard normal (z
distribution) when
large enough sample
size (
n
= 30+)
Computing a Confidence Interval –
Example
•
Suppose gathered game times in
a user study (e.g., for your MQP)
•
Can compute sample mean, yes
•
But really want to know where
population mean is
Bound with
confidence interval
Computing a Confidence Interval –
Example
(See next slide for depiction of meaning)
Need t
=TINV(0.1,31)
1.696
Meaning of Confidence Interval (
)
Experiment/Sample
Includes
?
1
yes
2
yes
3
no
…
e.g.,
100
yes
=0.1
Total
yes
>
100 (1-
)
90
Total
no
< 100
10
If 100 experiments and
confidence level is 90%:
90 cases interval includes
,
in 10 cases not include
How does Confidence Interval Size
Change?
•
With
sample size
(
N
)
•
With
confidence level
(1-
)
Look at each separately next
How does Confidence Interval Change
(1 of 2)?
•
What happens to
confidence interval
when
sample size
(
N
)
increases?
–
Hint:
think about
Standard Error
How does Confidence Interval Change
(1 of 2)?
•
What happens to
confidence interval
when
sample size
(
N
)
increases?
–
Hint:
think about
Standard Error
How does Confidence Interval Change
(2 of 2)?
•
What happens to
confidence interval
when
confidence level
(1-
)
increases?
•
90%
CI = [6.5, 9.4]
–
90% chance population
value is between 6.5, 9.4
•
95%
CI = [6.1, 9.8]
–
95% chance population
value is between 6.1, 9.8
•
Why is interval wider
when we are “more”
confident?
How does Confidence Interval Change
(2 of 2)?
•
What happens to
confidence interval
when
confidence level
(1-
)
increases?
•
90%
CI = [6.5, 9.4]
–
90% chance population
value is between 6.5, 9.4
•
95%
CI =
[6.1, 9.8]
–
95% chance population
value is between 6.1, 9.8
•
Why is interval
wider
when we are “more”
confident? See
distribution on the right
Groupwork –
Interpreting a Confidence Interval
https://web.cs.wpi.edu/~imgd2905/d23/groupwork
/9-conf-interp/handout.html
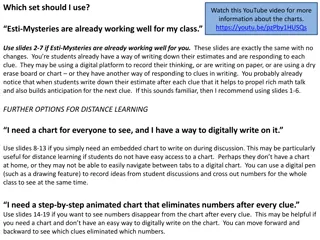
Using Confidence Interval (1 of 3)
•
For charts, depict with
e
rror bars
•
CI different than standard deviation
–
Standard deviation show spread
–
CI bounds population parameter (decreases with
N)
CI indicates range of
population
parameter
Make sure sample size
N
=30+
(
N
=15+ if somewhat normal.
Any
N
if know distro is normal)
Using Confidence Interval (2 of 3)
Compare two alternatives, quick check for statistical significance
https://measuringu.com/ci-10things/
•
No overlap
?
90% confident difference (at
=
0.10 level)
•
Large overlap
(50%+)?
N
o statistically significant diff (at
=
0.10 level)
•
Some overlap
?
more tests required
(Some overlap)
But if compute difference, and then
confidence interval does
not
cross 0!
(Caused by error propagation)
Using Confidence Interval (3 of 3)
[Some Overlap]
How
Not
to Use Confidence Intervals
(1 of 2)
•
Overlap – careful not to say no statistically
significant difference (see previous slide)
“The confidence intervals of the two groups
overlap
, hence
the difference is
not statistically significant
” — A lot of People
How
Not
to Use Confidence Intervals
(2 of 2)
•
Do not quantify variability (e.g., 95% of values
in interval)
https://www.graphpad.com/guides/prism/7/statistics/images/hmfile_hash_f71959f8.gif
“The 95% confidence interval goes from C1 to C2, so 95% of
all observations are between C1 and C2. — A lot of People
Statistical Significance versus Practical
Significance
It’s a Honey of an O
•
Boxes of Cheerios, Tastee-O’s
both target 12 oz.
•
Measure weight of 18,000
boxes (large
N
!)
•
Using statistics:
–
Cheerio’s heavier by 0.002 oz.
–
And statistically significant
(
=0.99)
!
•
But … 0.0002 is only 2-3 O’s.
Customer doesn’t care!
Latency can Kill?
•
Lag in League of Legends
•
Pay $$ to upgrade Internet
from 100 Mb/s to 1000 Mb/s
•
Measure ping to LoL server for
20,000 samples (large
N
!)
•
Using statistics
–
Ping times improve 0.8 ms
–
And statistically significant
(
=0.99)
!
•
But … below perception!
Warning:
may find statistically significant difference.
That doesn’t mean it is
important
.
(
Cohen’s d
)
Effect Size
•
Quantitative measure of
strength of finding
–
Measures
practical significance
•
Emphasizes
size of difference
of relationship
What Confidence Level to Use (1 of 2)?
•
Often see 90% or 95% (or even 99%) used
•
Choice based on
loss
if wrong (population parameter is
outside),
gain
if right (parameter inside)
–
If
loss
is high compared to
gain
, use higher confidence
–
If
loss
is low compared to
gain
, use lower confidence
–
If
loss
is negligible, lower is fine
•
Example (
loss
high compared to
gain
):
–
Hairspray, makes hair straight, but has chemicals
–
Want to be
99.9%
confident it doesn’t cause cancer
•
Example (
loss
low compared to
gain
):
–
Hairspray, makes hair straight, mainly water
–
Ok to be
75%
confident it straightens hair
What Confidence Level to Use (2 of 2)?
•
Often see 90% or 95% (or even 99%) used
•
Choice based on
loss
if wrong (population parameter is
outside),
gain
if right (parameter inside)
–
If
loss
is high compared to
gain
, use higher confidence
–
If
loss
is low compared to
gain
, use lower confidence
–
If
loss
is negligible, lower is fine
•
Example (
loss
negligible compared to
gain
):
–
Lottery ticket costs $1, pays $5 million
–
Chance of winning is 10
-7
(50% payout, so 1 in 10 million)
–
To win with
90%
confidence, need 9 million tickets
•
No one would buy that many tickets ($9 mil to win $5 mil)!
–
So, most people happy with
0.0001%
confidence
Outline
•
Overview
(
done
)
•
Foundation
(
done
)
•
Inferring Population Parameters
(
done
)
•
Hypothesis Testing
(
next
)
Hypothesis Testing
•
Term arises from science
–
State tentative explanation
hypothesis
–
Devise experiments to
gather data
–
Data
supports
or
rejects
hypothesis
•
Statisticians have adopted
to test using
inferential
statistics
Hypothesis testing
Just brief overview here
Conversant
Chapters 8 & 9
in book have more
Hypothesis Testing Terminology
•
Null Hypothesis (H
0
)
– hypothesis that no
significance difference between
measured value and population
parameter (any observed difference due
to error)
–
e.g., population mean time for Riot to bring
up NA servers is 4 hours
•
Alternative Hypothesis
– hypothesis
contrary to null hypothesis
–
e.g., population mean time for Riot to bring
up NA servers is
not
4 hours
•
Care about
Alternate
, but test
Null
–
If data supports,
Alternate
may not be true
–
If data rejects,
Alternate
may
be true
•
Why
Null
and
Alternate
?
–
Remember, data doesn’t “prove” hypothesis
–
Can only reject it at certain significance
(e.g., there is probably a difference)
–
So, reject
Null
•
P value
– smallest level that can
reject
H
0
“If
p value
is low, then
H
0
must go”
•
How “low” based on “risk” of being
wrong (like confidence interval)
Example – Peppermint Essential Oil
Essential oils - peppermint oil helps anxiety?
1.
Null hypothesis
- Peppermint oil no effect on anxiety
2.
Alternative hypothesis
- Peppermint essential oil
alleviates anxiety
3.
Significance level
- significance
0.25
(75%)
4.
Experiment
- One group with peppermint oil and
another with placebo, compute difference in self-
reported anxiety
5.
P-value
- p-value is
0.05
6.
Conclusion
- difference is statistically significant
(below 0.25).
Reject Null, so
support for alternative
hypothesis that peppermint oil can alleviate anxiety
Example – Vitamin C and Colds
Vitamin C prevents common cold?
1.
Null hypothesis
- Take vitamin C no less likely to become ill
2.
Alternative hypothesis
- Take vitamin C less likely to
become ill
3.
Significance level
- significance
0.05
(95%)
4.
Experiment -
one group vitamin C, other placebo, and
record whether or not participants got cold
5.
P-value
- p-value is
0.20
6.
Conclusion
- difference is not significant (0.20
≰
0.5). F
ail to
reject Null hypothesis. No support for alternative
hypothesis that vitamin C can prevent colds
Hypothesis Testing Steps
1.
State hypothesis (
H
) and null hypothesis (
H
0
)
2.
Evaluate risks of being wrong (based on loss and
gain), choosing significance (
)
and sample size (
N
)
3.
Collect data (
sample
), compute statistics
4.
Calculate
p value
based on test statistic and
compare to
5.
Make inference
–
Reject
H
0
if
p value
less than
•
So,
H
may be right
–
Do not reject
H
0
if
p value
greater than
•
So,
H
may not be right
Hypothesis Testing Steps (Example)
•
State hypothesis (
H
) and null hypothesis (
H
0
)
–
H
: Mario level takes more than 5 minutes to complete
–
H
0
: Mario level takes 5 minutes to complete (
H
0
always has =)
•
Evaluate risks of being wrong (based on loss and gain),
choosing significance (
) and sample size (
N
)
–
Player may get frustrated, quit game, so
= 0.1
–
Without distribution analysis,
30
(Central Limit Theorem)
•
Collect data (
sample
), compute statistics
–
30
people play level, compute average minutes, compare to 5
–
E.g., mean of 6.1 minutes
•
Calculate
p value
based on test statistic and compare to
–
P value
= 0.02,
= 0.1
–
“How likely is it that the true mean is 5 when measure 6.1?”
•
Make inference
–
Here:
p value
less than
REJECT
H
0
, so
H
may be right
–
Note, would not have rejected
H
0
if
p value
greater than
Depiction of P Value
Probability density of
each outcome, computed under
Null
hypothesis
p
value
is area under curve past
observed data point
(e.g., sample mean)
E.g., Mario mean of 5, so
is 6.1. in the “unlikely”
region?
Observed
mean 6.1
Hypo.
mean 5
Groupwork
1.
In Hypothesis testing, the Null Hypothesis
2.
Game development team wants new model
assessed. Steps?
https://web.cs.wpi.edu/~imgd2905/d23/groupwork/
10-hypo-testing/handout.html
Groupwork
1.
In Hypothesis testing, the Null Hypothesis (H0)
is:
a.
conf interval of sample mean crosses zero/Null
b.
sample mean is within a standard error of the
population mean
c.
no significance difference between measured
and population
d.
all of the above
e.
none of the above
Groupwork
2. Your game development team wants to see if the
new Hero
model they created is played more often
than the
old Hero
(
10%
).
They task you with doing
this assessment. What steps do you take?
a.
Create
H
and
H0
, pick
, decide
N
b.
Gather data
c.
Compute sample mean
d.
Test (compute
p value
)
e.
Analyze results to accept or reject
Explore probability distributions by rolling dice, starting with a single die and progressing to multiple dice rolls. Understand how the distribution changes as more dice are rolled and how it affects the shape of the distribution curve. Practice inferring population parameters through hypothesis testing using statistics and visualize the concept through engaging group work activities.

Download Presentation

Please find below an Image/Link to download the presentation.
The content on the website is provided AS IS for your information and personal use only. It may not be sold, licensed, or shared on other websites without obtaining consent from the author.If you encounter any issues during the download, it is possible that the publisher has removed the file from their server.
You are allowed to download the files provided on this website for personal or commercial use, subject to the condition that they are used lawfully. All files are the property of their respective owners.
The content on the website is provided AS IS for your information and personal use only. It may not be sold, licensed, or shared on other websites without obtaining consent from the author.
E N D
Presentation Transcript
IMGD 2905 Inferential Statistics Chapter 6 & 7
Overview Use statistics to infer population parameters http://3.bp.blogspot.com/_94E2PdKwaXE/S-xQRuoiKAI/AAAAAAAAABY/xvDRcG_Mcj0/s1600/120909_0159_1.png Inferential statistics
Outline Overview Foundation Inferring Population Parameters Hypothesis Testing (done) (next)
Groupwork Remember, probability distribution shows possible outcomes on x-axis and probability of each on y-axis. 1. Describe the probability distribution of 1 d6? 2. Describe the probability distribution of 2 d6? 3. Describe the probability distribution of 3 d6? Icebreaker, Groupwork, Questions https://web.cs.wpi.edu/~imgd2905/d23/groupwork/6-prob-dist/handout.html https://academo.org/demos/dice-roll-statistics/
Dice Rolling (1 of 4) Have 1d6, sample (i.e., roll 1 die) What is probability distribution of values?
Dice Rolling (1 of 4) Have 1d6, sample (i.e., roll 1 die) What is probability distribution of values? Square distribution http://www.investopedia.com/articles/06/probabilitydistribution.asp
Dice Rolling (2 of 4) Have 1d6, sample twice and sum (i.e., roll 2 dice) What is probability distribution of values?
Dice Rolling (2 of 4) Have 1d6, sample twice and sum (i.e., roll 2 dice) What is probability distribution of values? Triangle distribution http://www.investopedia.com/articles/06/probabilitydistribution.asp
Dice Rolling (3 of 4) Have 1d6, sample thrice and sum (i.e., roll 3 dice) What is probability distribution of values?
Dice Rolling (3 of 4) Have 1d6, sample thrice and sum (i.e., roll 3 dice) What is probability distribution of values? What s happening to the shape? http://www.investopedia.com/articles/06/probabilitydistribution.asp
Dice Rolling (3 of 4) Have 1d6, sample thrice and sum (i.e., roll 3 dice) What is probability distribution of values? What s happening to the shape?
Dice Rolling (4 of 4) Same holds for general experiments with dice (i.e., observing sample sum and mean of dice rolls) Resulting sum/mean follows a normal distribution Even though base distribution is uniform! http://www.muelaner.com/uncertainty-of-measurement/ Ok, neat for square distributions (e.g., d6). But what about experiments with other distributions?
Sampling Distributions With large enough sample size, sum/mean looks bell- shaped Normal! How many is large enough? 30 (15 if symmetric distribution) Central Limit Theorem Sum of independent variables tends towards Normal distribution http://flylib.com/books/2/528/1/html/2/images/figu115_1.jpg
Sampling Distributions With large enough sample size, sum/mean looks bell- shaped Normal! How many is large enough? 30 (15 if symmetric distribution) Central Limit Theorem Sum of independent variables tends towards Normal distribution http://flylib.com/books/2/528/1/html/2/images/figu115_1.jpg
Sampling Distributions With large enough sample size, sum/mean looks bell- shaped Normal! How many is large enough? 30 (15 if symmetric distribution) Central Limit Theorem Sum of independent variables tends towards Normal distribution http://flylib.com/books/2/528/1/html/2/images/figu115_1.jpg
Sampling Distributions With large enough sample size, sum/mean looks bell- shaped Normal! How many is large enough? 30 (15 if symmetric distribution) Central Limit Theorem Sum of independent variables tends towards Normal distribution http://flylib.com/books/2/528/1/html/2/images/figu115_1.jpg
Sampling Distributions With large enough sample size, sum/mean looks bell- shaped Normal! How many is large enough? 30 (15 if symmetric distribution) Central Limit Theorem Sum of independent variables tends towards Normal distribution http://flylib.com/books/2/528/1/html/2/images/figu115_1.jpg
Sampling Distributions With large enough sample size, sum/mean looks bell- shaped Normal! How many is large enough? 30 (15 if symmetric distribution) Central Limit Theorem Sum of independent variables tends towards Normal distribution http://flylib.com/books/2/528/1/html/2/images/figu115_1.jpg
Sampling Distributions With large enough sample size, sum/mean looks bell- shaped Normal! How many is large enough? 30 (15 if symmetric distribution) Central Limit Theorem Sum of independent variables tends towards Normal distribution http://flylib.com/books/2/528/1/html/2/images/figu115_1.jpg
Sampling Distributions With large enough sample size, sum/mean looks bell- shaped Normal! How many is large enough? 30 (15 if symmetric distribution) Central Limit Theorem Sum/mean of independent variables tends towards Normal distribution http://flylib.com/books/2/528/1/html/2/images/figu115_1.jpg
Why do we care about sample means following Normal distribution? What if we had only a sample mean and no measure of spread e.g., mean score is 3 What can we say about population mean? Not a whole lot! Yes, population mean could be 6. But could be 0. How likely are each? No idea! A A B B Sample mean Population mean?
Why do we care about sample means following Normal distribution? Remember this? http://www.six-sigma-material.com/images/PopSamples.GIF Allows us to predict range to bound population mean (see next slide) With mean and standard deviation
Why do we care about sample means following Normal distribution? Sample mean Actual population mean (probably) in this range! Probable range of population mean
Outline Overview Foundation Inferring Population Parameters Hypothesis Testing (done) (done) (next)
Estimating Population Mean Underlying data follows uniform probability distribution (d6) But assume population mean unknown (Example) Sample 1 d6 2 d6 (4 + 2) / 2 = 3 d6 (1 + 6 + 2) / 3 = 4 d6 (4 + 4 + 2 + 3) / 4 = 3.3 Sample Mean 4.0 3.0 2.3 Q: How do we estimate the population mean?
Estimating Population Mean Sample size 50 Q: What happens as sample size increases? Q: How big a sample do we need? Depends upon how much varies Values that are not the mean are an error sampling error https://demonstrations.wolfram.com/La wOfLargeNumbersDiceRollingExample/
Estimating Population Mean Sample size 50 Q: What happens as sample size increases? Q: How big a sample do we need? Depends upon how much varies Values that are not the mean contribute to error sampling error Sample size 500 Sample size 5000 https://demonstrations.wolfram.com/La wOfLargeNumbersDiceRollingExample/
Sampling Error Error from estimating population parameters from sample statistics is sampling error Exact error often cannot be known (do not know population parameters) But size of error based on: Variation in population ( ) itself more variation, more sample statistic variation (s) Sample size (N) larger sample, lower error Q: Why can t we just make sample size super large? How much does it vary? Standard error high variance low variance
Standard Error Amount sample means will vary from experiment to experiment of same size Standard deviation of the sample means Also, likelihood that sample statistic is near population parameter s What does the size of the standard error depend upon? (Hint: see formula above) So what? Reason about population mean e.g., 95% confident that sample mean is within ~ 2 SE s (where does this come from?)
Standard Error Amount sample means will vary from experiment to experiment of same size Standard deviation of the sample means Also, likelihood that sample statistic is near population parameter s Depends upon sample size (N) Depends upon standard deviation (s) So what? Reason about population mean e.g., 95% confident that sample mean is within ~ 2 SE s (where does this come from?) (Example next)
Standard Error (2 of 2) standard error, 100 experiments, N=3 If N=20: If N = 20: What will happen to means? What will happen to bars? How many will cross the blue line? What will happen to x s? What will happen to dots? Groupwork! http://www.biostathandbook.com/standarderror.html
Groupwork 1. How many of the bars intersect the blue? 2. What do graphs look like N = 20? 3. Now, how many bars intersect? Standard Error https://web.cs.wpi.edu/~imgd2905/d23/groupwork/7-std- error/handout.html standard error, 100 experiments, N=3
Standard Error (2 of 2) standard error, 100 experiments, N=3 If N=20: If N = 20: What will happen to means? What will happen to bars? How many will cross the blue line? What will happen to x s? What will happen to dots? http://www.biostathandbook.com/standarderror.html
Standard Error (2 of 2) standard error, 100 experiments, N=3 standard error, 100 experiments, N=20 How many cross the blue line? Estimate population parameter confidence interval http://www.biostathandbook.com/standarderror.html
Confidence Interval Range of values with specific certainty that population parameter is within e.g., 90% confidence interval for mean League of Legends match duration: [28.5 minutes, 32.5 minutes] Have sample of durations Compute interval containing mean population duration ( ) (with 90% confidence) In general: probability of in interval [c1,c2] with A confidence Mean: 30.5 28.5 32.5
Confidence Interval for Mean Probability of in interval [c1,c2] P(c1 < < c2) = 1- [c1, c2] is confidence interval is significance level 100(1- ) is confidence level Typically want small so confidence level 90%, 95% or 99% (more on effect later) Say, = 0.1. Could do k experiments (size n), find sample means, sort Graph distribution Interval from distribution: Lower bound: 5% Upper bound: 95% 90% confidence interval So, do we have to do k experiments, each of size n?! http://www.comfsm.fm/~dleeling/statistics/notes009_normalcurve90.png
Confidence Interval Estimate Estimate interval from 1 experiment, size n Compute sample mean ( ?), sample standard error (SE) Multiply SE by t distribution Add/subtract from sample mean Confidence interval e.g., mean 30.5 t x SE = 2 30.5 - 2 = 28.5 30.5 + 2 = 32.5 [28.5, 32.5] Ok, what is t distribution? Function, parameterized by and n
t distribution Looks like standard normal, but bit squashed Gets more less squashed as n gets larger Note, can use standard normal (z distribution) when large enough sample size (n = 30+) aka student s t distribution ( student was anonymous name used when published by William Gosset) http://ci.columbia.edu/ci/premba_test/c0331/images/s7/6317178747.gif
Computing a Confidence Interval Example (Unsorted) Game Time Suppose gathered game times in a user study (e.g., for your MQP) Can compute sample mean, yes But really want to know where population mean is Bound with confidence interval 4.4 3.8 2.8 4.2 2.8 2.9 1.9 5.9 3.9 3.2 4.1 5.3 3.6 5.1 2.7 3.9 3.9 3.2 4.1 3.3 2.8 4.2 3.1 4.5 4.5 4.8 4.9 5.1 3.7 3.4 5.6 3.1
Computing a Confidence Interval Example (Sorted) Game Time A 90% confidence interval ( is 0.1) for population mean ( ): 3.90 1.696 0.95 32 = [3.62, 4.19] ? = 3.90, stddev s=0.95, n=32 1.9 2.7 2.8 2.8 2.8 2.9 3.1 3.1 3.2 3.2 3.3 3.4 3.6 3.7 3.8 3.9 3.9 3.9 4.1 4.1 4.2 4.2 4.4 4.5 4.5 4.8 4.9 5.1 5.1 5.3 5.6 5.9 Need t =TINV(0.1,31) 1.696 With 90% confidence, in that interval. Chance of error 10%. But, what does that mean? (See next slide for depiction of meaning)
Meaning of Confidence Interval () If 100 experiments and confidence level is 90%: 90 cases interval includes , in 10 cases not include f(x) Includes ? yes yes no yes yes > 100 (1- ) 90 no < 100 Experiment/Sample 1 2 3 100 Total Total =0.1 e.g., 10
How does Confidence Interval Size Change? With sample size (N) With confidence level (1- ) Look at each separately next
How does Confidence Interval Change (1 of 2)? What happens to confidence interval when sample size (N) increases? Hint: think about Standard Error
How does Confidence Interval Change (1 of 2)? What happens to confidence interval when sample size (N) increases? Hint: think about Standard Error
How does Confidence Interval Change (2 of 2)? What happens to confidence interval when confidence level (1- )increases? 90% CI = [6.5, 9.4] 90% chance population value is between 6.5, 9.4 95% CI = [6.1, 9.8] 95% chance population value is between 6.1, 9.8 Why is interval wider when we are more confident? http://vassarstats.net/textbook/f1002.gif
How does Confidence Interval Change (2 of 2)? What happens to confidence interval when confidence level (1- )increases? 90% CI = [6.5, 9.4] 90% chance population value is between 6.5, 9.4 95% CI = [6.1, 9.8] 95% chance population value is between 6.1, 9.8 Why is interval wider when we are more confident? See distribution on the right http://vassarstats.net/textbook/f1002.gif
Groupwork Interpreting a Confidence Interval https://web.cs.wpi.edu/~imgd2905/d23/groupwork /9-conf-interp/handout.html
Using Confidence Interval (1 of 3) For charts, depict with error bars CI different than standard deviation Standard deviation show spread CI bounds population parameter (decreases with N) CI indicates range of population parameter Make sure sample size N=30+ (N=15+ if somewhat normal. Any N if know distro is normal)
Using Confidence Interval (2 of 3) https://measuringu.com/ci-10things/ No overlap Large overlap Some overlap Compare two alternatives, quick check for statistical significance No overlap? 90% confident difference (at = 0.10 level) Large overlap (50%+)? No statistically significant diff (at = 0.10 level) Some overlap? more tests required
Using Confidence Interval (3 of 3) [Some Overlap] (Some overlap) (Here is the overlap) But if compute difference, and then confidence interval does not cross 0! (Caused by error propagation)


")
")
")
")
")
")
")
")


")

")
")


")


")
")
")