Probability Distributions in the 108th Congress


The composition of the 108
th
Congress is 51
Republicans, 48 Democrats, and 1
Independent. A committee on aid to higher
education is formed with 3 Senators to be
chosen at random to head the committee. Find
the probability that the group of 3 consists of…
a)
All Republicans
b)
All Democrats
c)
One Democrat, one Republican, and one
Independent
 undefined


Objectives:
Construct a probability distribution for a random variable.
Find the mean, variance, standard deviation, and expected value for a
discrete random variable.
Find the exact probability for X successes in n trials of a binomial experiment.
Find the mean, variance, standard deviation for the variable of a binomial
distribution.
Find the probabilities for outcomes of variables using the Poisson distribution.
Before we get started, let’s review some old vocab
…
1.
V
ariable
– a characteristic or attribute that can assume different
values.
a)
V
arious letters of the alphabet, such as X, Y, Z, are used to represent
variables.
b)
S
ince the variables in this chapter are associated with probability,
they are called
random variables
.
c)
R
andom variable – a variable whose values are determined by
chance.
2.
Discrete variable
– have finite number of possible values, or an
infinite number of values that can be counted.
a)
W
hole numbers
3.
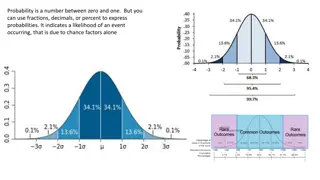
Continuous variable
– can assme all values in the interval
between any two given values.
a)
F
ractions, decimals.
A person’s weight
The outcomes when
you flip a coin
The outcomes
when a die is
rolled
The temperature
throughout 4
hours
Discrete Probability Distribution
– consists of the
values a random variable can assume and the
corresponding probabilities of the values. The
probabilities are determined theoretically or by
observation.
Theoretical
Represent graphically the probability
distribution for the sample space for tossing
three coins.
Observational
The baseball teams
playing in the World
Series play until one team
wins four times. This
means there can be
anywhere from 4-7
games. Find the
probability P(X) for each
X, construct a probability
distribution, and draw a
graph for the data.
The probability of each
event in the sample space
must be between or equal
to 0 and 1; that is,
0 ≤ P(X) ≤ 1
The sum of the
probabilities of all the
events in the sample
space must equal 1;
that is,
ΣP(X) = 1
a)
b)
c)
d)
Suppose that 7 people enter a swim
meet. Assuming that there are no ties,
in how many ways could the gold,
silver, and bronze medals be awards?
We are familiar with finding mean, variance,
and standard deviation. However, for
probability distributions they are computed
differently than they are for samples.
How would you compute the mean of the number of dots
that show on top when a die is rolled? You could roll it, say,
10 times, recording the number of dots, and finding the
mean; however the answer would only approximate the
true mean.
To get an exact answer, we would have to roll the die an
infinite number of times
. Since this is impossible, we cannot
use the old way to compute the mean.
Suppose two coins are tossed repeatedly, and the number of heads
that occurred is recorded. What will be the mean of the number of
heads?
What is the sample space?
What is the probability for each outcome in the sample space?
Probability of one head?
Probability of two heads?
Probability of no heads?
The mean of a random variable with a discrete probability
distribution is
μ
= X
1
× P(X
1
) + X
2
× P(X
2
) +
…. + X
n
× P(X
n
)
μ
= ΣX × P(X)
where
X
1
, X
2
,
…, X
n
are the outcomes and
P(X
1
), P(X
2
), ...P(X
n
)
are the
corresponding probabilities.
**Note:
μ
= ΣX × P(X)
means to sum the products.
To find the
variance
for the random variable of
a probability distribution, subtract the
theoretical mean from the each outcome and
square the difference. Then multiply each
difference by its corresponding probability and
add the products.
σ
2
= Σ[(X – μ)
2
× P(X)]
However, this is tedious, so here’s a shortcut
…
Find the
variance
of a probability distribution by multiplying the
square of each outcome by its corresponding probability, summing
the products, and subtracting the square of the theoretical mean.
σ
2
= Σ[X
2
× P(X)] – μ
2
****This is the shortcut. Use this one!****
As always, the standard deviation is just the square root of the
variance.
1.
Find the mean, variance, and standard deviation of the
number of dots that appear when a die is tossed.
2.
A box contains 5 balls. Two are numbered 3, one is
numbered 4, and two are numbered 5. The balls are
mixed and one is selected at random. After a ball is
selected, it is recorded and replaced. If the experiment is
repeated many times, find the mean, variance, and
standard deviation of the numbers on the balls.
3.
A talk radio station has four telephone lines. If the host is unable
to talk (i.e. during a commercial) or is talking to a person, the
other called are placed on hold. When all lines are in use, others
who are trying to call in get a busy signal. The probability that 0,
1, 2, 3, or 4 people will get through is shown in the distribution.
Find the mean, variance, and standard deviation for the
distribution.
Should the station have considered getting more phone lines
installed?
The expected value of a discrete random variable of a probability distribution is
the theoretical average of the variable.
μ
= E(X) = ΣX × P(X)
The symbol E(X) is used for the expected value.
The formula is the same as the theoretical mean.
Expected value = Theoretical mean
1.
One thousand tickets are sold at $1 each for a color television valued at $350.
What is the expected value of the gain if you purchase one ticket?
2.
One thousand tickets are sold at $1 each for four prizes of $100, $50, $25, and
$10. After each prize drawing, the winning ticket is then returned to the pool of
tickets. What is the expected value if you purchase one ticket?
3.
A financial adviser suggests that his client select one of two types of bonds in
which to invest $5,000. Bond X pays a return of 4% and has a default rate of 2%.
Bond Y has a 2.5% return and a default rate of 1%. Find the expected rate of
return and decide which bond would be a better investment. When the bond
defaults, the investor loses all the investment.
500 tickets are sold at $1 each for
an iPad valued at $400. What is
the expected value of the gain if
you purchase one ticket?
Many types of probability problems have only two outcomes or can
be reduced to two outcomes.
Coin toss
Winning or losing a game
Baby being male or female
True/false questions
Effective or ineffective medical treatment
Normal or abnormal blood pressure
Correct or incorrect answer
A
binomial experiment
is a probability experiment that satisfies the following
four requirements:
1.
There must be a fixed number of trials.
2.
Each trial can only have two outcomes, or outcomes that can be reduced to two
outcomes. These outcomes can be considered as success or failure.
3.
The outcomes of each trial must be independent of one another.
4.
The probability of a success must remain the same for each trial.
The outcomes of a binomial experiment and the corresponding probabilities of
these outcomes are called a
binomial distribution
.
In a binomial experiment, the probability of exactly X
successes in n trials is
P(X) =
n!
× p
X
× q
n – X
(n – X)! X!
A package contains 12 resistors, 3
of which are defective. If 4 are
selected, find the probability of
getting 1 defective resistor.
1.
A coin is tossed 3 times. Find the probability of getting exactly 2
heads.
2.
A survey found that one out of five Americans say he or she has
visited a doctor in any given month. If 10 people are selected at
random, find the probability that exactly 3 will have visited a
doctor last month.
3.
A survey from Teenage Research Unlimited found that 30% of
teenage consumers receive their spending money from part-time
jobs. If 5 teenagers are selected at random, find the probability
that at least 3 of them will have part-time jobs.
4.
Public Opinion
reported that 5% of Americans are afraid
of being alone in a house at night. If a random sample of
20 Americans is selected, find these probabilities by
using the binomial table.
a)
There are exactly 5 people in the sample who are afraid of being
alone at night.
b)
There are at most 3 people in the sample who are afraid of being
alone at night.
c)
There are at least 3 people in the sample who are afraid of being
alone at night.
Mean:
μ
= n × p
Variance:
σ
2
= n × p × q
Standard Deviation:
σ
= sqrt(n × p × q)
1.
A coin it tossed 4 times. Find the mean, variance, and standard deviation of the
number of heads that will be obtained.
2.
A die is rolled 360 times. Find the mean, variance, and standard deviation of the
number of 4s that will be rolled.
3.
The
Statistics Bulletin
published by Metropolitan Life Insurance Co. reported that
2% of all American births result in twins. If a random sample of 8,000 births is
taken, find the mean, variance, and standard deviation of the number of births
that would result in twins.
The composition of the 108th Congress includes 51 Republicans, 48 Democrats, and 1 Independent. A committee on aid to higher education is formed with 3 Senators chosen at random to head the committee. The probability of selecting all Republicans, all Democrats, and a mix of one Democrat, one Republican, and one Independent is calculated. The concept of discrete probability distributions, random variables, and probability distributions is explored with examples and objectives provided.

Download Presentation

Please find below an Image/Link to download the presentation.
The content on the website is provided AS IS for your information and personal use only. It may not be sold, licensed, or shared on other websites without obtaining consent from the author.If you encounter any issues during the download, it is possible that the publisher has removed the file from their server.
You are allowed to download the files provided on this website for personal or commercial use, subject to the condition that they are used lawfully. All files are the property of their respective owners.
The content on the website is provided AS IS for your information and personal use only. It may not be sold, licensed, or shared on other websites without obtaining consent from the author.
E N D
Presentation Transcript
DO NOW The composition of the 108thCongress is 51 Republicans, 48 Democrats, and 1 Independent. A committee on aid to higher education is formed with 3 Senators to be chosen at random to head the committee. Find the probability that the group of 3 consists of a) All Republicans b)All Democrats c) One Democrat, one Republican, and one Independent
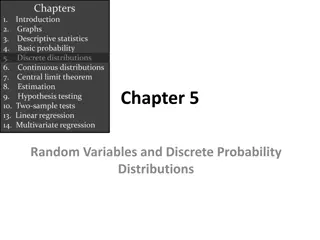
DISCRETE PROBABILITY DISTRIBUTIONS
DISCRETE PROBABILITY DISTRIBUTIONS Objectives: Construct a probability distribution for a random variable. Find the mean, variance, standard deviation, and expected value for a discrete random variable. Find the exact probability for X successes in n trials of a binomial experiment. Find the mean, variance, standard deviation for the variable of a binomial distribution. Find the probabilities for outcomes of variables using the Poisson distribution.
PROBABILITY DISTRIBUTIONS Before we get started, let s review some old vocab Variable a characteristic or attribute that can assume different values. a) Various letters of the alphabet, such as X, Y, Z, are used to represent variables. b) Since the variables in this chapter are associated with probability, they are called random variables. c) Random variable a variable whose values are determined by chance. 1. Discrete variable have finite number of possible values, or an infinite number of values that can be counted. a) Whole numbers 2. Continuous variable can assme all values in the interval between any two given values. a) Fractions, decimals. 3.
DISCRETE OR CONTINUOUS? The outcomes when a die is rolled A person s weight The temperature throughout 4 hours The outcomes when you flip a coin
PROBABILITY DISTRIBUTION Discrete Probability Distribution consists of the values a random variable can assume and the corresponding probabilities of the values. The probabilities are determined theoretically or by observation.
THEORETICAL VS. OBSERVATIONAL Theoretical Represent graphically the probability distribution for the sample space for tossing three coins.
THEORETICAL VS. OBSERVATIONAL Observational The baseball teams playing in the World Series play until one team wins four times. This means there can be anywhere from 4-7 games. Find the probability P(X) for each X, construct a probability distribution, and draw a graph for the data. X Number of games played 8 7 9 16 4 5 6 7
TWO REQUIREMENTS FOR A PROBABILITY DISTRIBUTION The sum of the probabilities of all the events in the sample space must equal 1; that is, The probability of each event in the sample space must be between or equal to 0 and 1; that is, 0 P(X) 1 P(X) = 1
DETERMINE WHETHER EACH IS A PROBABILITY DISTRIBUTION a) X P(X) 0 1/5 5 1/5 10 1/5 15 1/5 20 1/5 b) X P(X) 1 1/4 2 1/8 3 1/16 4 9/16 c) X P(X) 0 -1.0 2 1.5 4 0.3 6 0.2 d) X P(X) 2 0.5 3 0.3 7 0.4
DO NOW Suppose that 7 people enter a swim meet. Assuming that there are no ties, in how many ways could the gold, silver, and bronze medals be awards?
MEAN, VARIANCE, STDEV, EXPECTED VALUES We are familiar with finding mean, variance, and standard deviation. However, for probability distributions they are computed differently than they are for samples.
MEAN How would you compute the mean of the number of dots that show on top when a die is rolled? You could roll it, say, 10 times, recording the number of dots, and finding the mean; however the answer would only approximate the true mean. To get an exact answer, we would have to roll the die an infinite number of times. Since this is impossible, we cannot use the old way to compute the mean.
MEAN Suppose two coins are tossed repeatedly, and the number of heads that occurred is recorded. What will be the mean of the number of heads? What is the sample space? What is the probability for each outcome in the sample space? Probability of one head? Probability of two heads? Probability of no heads?
Hence, on average, you would expect the number of heads to be 1 4 2 +1 2 1 +1 4 0 = 1 That is, if it were possible to toss the coins many times or an infinite number of times, the average number of heads would be 1. So to find the mean for a probability distribution, you must multiply each possible outcome by its corresponding probability and find the sum of the products
MEAN The mean of a random variable with a discrete probability distribution is = X1 P(X1) + X2 P(X2) + . + Xn P(Xn) = X P(X) where X1, X2, , Xnare the outcomes and P(X1), P(X2), ...P(Xn) are the corresponding probabilities. **Note: = X P(X) means to sum the products.
VARIANCE AND STANDARD DEVIATION To find the variance for the random variable of a probability distribution, subtract the theoretical mean from the each outcome and square the difference. Then multiply each difference by its corresponding probability and add the products. 2 = [(X )2 P(X)] However, this is tedious, so here s a shortcut
VARIANCE AND STANDARD DEVIATION Find the variance of a probability distribution by multiplying the square of each outcome by its corresponding probability, summing the products, and subtracting the square of the theoretical mean. 2 = [X2 P(X)] 2 ****This is the shortcut. Use this one!**** As always, the standard deviation is just the square root of the variance.
EXAMPLES 1. Find the mean, variance, and standard deviation of the number of dots that appear when a die is tossed. 2. A box contains 5 balls. Two are numbered 3, one is numbered 4, and two are numbered 5. The balls are mixed and one is selected at random. After a ball is selected, it is recorded and replaced. If the experiment is repeated many times, find the mean, variance, and standard deviation of the numbers on the balls.
EXAMPLES A talk radio station has four telephone lines. If the host is unable to talk (i.e. during a commercial) or is talking to a person, the other called are placed on hold. When all lines are in use, others who are trying to call in get a busy signal. The probability that 0, 1, 2, 3, or 4 people will get through is shown in the distribution. Find the mean, variance, and standard deviation for the distribution. 3. X P(X) 0 0.18 1 0.34 2 0.23 3 0.21 4 0.04 Should the station have considered getting more phone lines installed?
EXPECTED VALUE The expected value of a discrete random variable of a probability distribution is the theoretical average of the variable. = E(X) = X P(X) The symbol E(X) is used for the expected value. The formula is the same as the theoretical mean. Expected value = Theoretical mean
EXAMPLES One thousand tickets are sold at $1 each for a color television valued at $350. What is the expected value of the gain if you purchase one ticket? 1. One thousand tickets are sold at $1 each for four prizes of $100, $50, $25, and $10. After each prize drawing, the winning ticket is then returned to the pool of tickets. What is the expected value if you purchase one ticket? 2.
EXAMPLES A financial adviser suggests that his client select one of two types of bonds in which to invest $5,000. Bond X pays a return of 4% and has a default rate of 2%. Bond Y has a 2.5% return and a default rate of 1%. Find the expected rate of return and decide which bond would be a better investment. When the bond defaults, the investor loses all the investment. 3.
DO NOW 500 tickets are sold at $1 each for an iPad valued at $400. What is the expected value of the gain if you purchase one ticket?
THE BINOMIAL DISTRIBUTION Many types of probability problems have only two outcomes or can be reduced to two outcomes. Coin toss Winning or losing a game Baby being male or female True/false questions Effective or ineffective medical treatment Normal or abnormal blood pressure Correct or incorrect answer
THE BINOMIAL DISTRIBUTION A binomial experiment is a probability experiment that satisfies the following four requirements: 1. There must be a fixed number of trials. 2. Each trial can only have two outcomes, or outcomes that can be reduced to two outcomes. These outcomes can be considered as success or failure. 3. The outcomes of each trial must be independent of one another. 4. The probability of a success must remain the same for each trial. The outcomes of a binomial experiment and the corresponding probabilities of these outcomes are called a binomial distribution.
NOTATION FOR BINOMIAL DISTRIBUTION P(S) P(F) p Probability of Success Probability of Failure Numerical Probability of Success q Numerical Probability of Failure P(S) = p and P(F) = 1 p = q n X Number of Trials Number of Successes in n Trials ***Note that 0 X n and X = 0, 1, 2, 3, , n.
BINOMIAL PROBABILITY FORMULA In a binomial experiment, the probability of exactly X successes in n trials is P(X) = n! pX qn X (n X)! X!
DO NOW A package contains 12 resistors, 3 of which are defective. If 4 are selected, find the probability of getting 1 defective resistor.
EXAMPLES 1. A coin is tossed 3 times. Find the probability of getting exactly 2 heads. 2. A survey found that one out of five Americans say he or she has visited a doctor in any given month. If 10 people are selected at random, find the probability that exactly 3 will have visited a doctor last month. 3. A survey from Teenage Research Unlimited found that 30% of teenage consumers receive their spending money from part-time jobs. If 5 teenagers are selected at random, find the probability that at least 3 of them will have part-time jobs.
EXAMPLES 4. Public Opinion reported that 5% of Americans are afraid of being alone in a house at night. If a random sample of 20 Americans is selected, find these probabilities by using the binomial table. a) There are exactly 5 people in the sample who are afraid of being alone at night. b) There are at most 3 people in the sample who are afraid of being alone at night. c) There are at least 3 people in the sample who are afraid of being alone at night.
MEAN, VARIANCE, STDEV Mean: = n p Variance: 2 = n p q Standard Deviation: = sqrt(n p q)
EXAMPLES A coin it tossed 4 times. Find the mean, variance, and standard deviation of the number of heads that will be obtained. 1. A die is rolled 360 times. Find the mean, variance, and standard deviation of the number of 4s that will be rolled. 2. The Statistics Bulletin published by Metropolitan Life Insurance Co. reported that 2% of all American births result in twins. If a random sample of 8,000 births is taken, find the mean, variance, and standard deviation of the number of births that would result in twins. 3.