Predicting Students' Course Success Using Machine Learning Approach at CAIR Annual Conference
Utilizing a machine learning approach, Amanda Bain, Tanner Carollo, Akira Kanatsu, and their team present findings on predicting students' course success at the CAIR 2018 Annual Conference. The research focuses on data analysis, model training, and the impact on retention and graduation rates, offering insights into enhancing educational outcomes through advanced technology.
Download Presentation

Please find below an Image/Link to download the presentation.
The content on the website is provided AS IS for your information and personal use only. It may not be sold, licensed, or shared on other websites without obtaining consent from the author.If you encounter any issues during the download, it is possible that the publisher has removed the file from their server.
You are allowed to download the files provided on this website for personal or commercial use, subject to the condition that they are used lawfully. All files are the property of their respective owners.
The content on the website is provided AS IS for your information and personal use only. It may not be sold, licensed, or shared on other websites without obtaining consent from the author.
E N D
Presentation Transcript
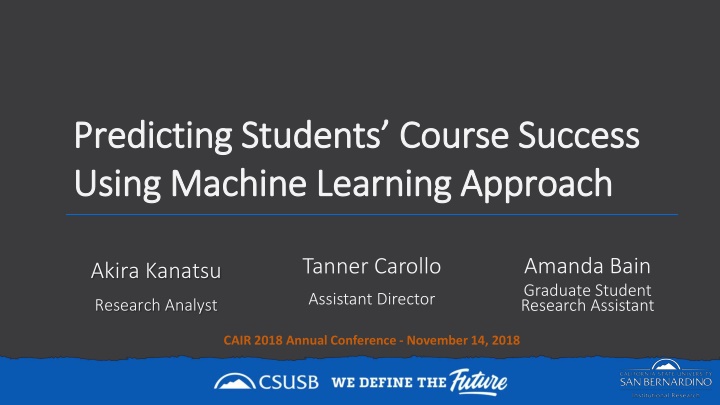
Predicting Students Course Success Predicting Students Course Success Using Machine Learning Approach Using Machine Learning Approach Amanda Bain Graduate Student Research Assistant Tanner Carollo Akira Kanatsu Assistant Director Research Analyst CAIR 2018 Annual Conference - November 14, 2018
Outline At a Glance Why Course Success Machine Learning Approach Data and Model Training Results Next Steps
At a Glance At a Glance Undergraduate Student Population 17,854 (89%) Fall 2018 Lecture/Seminar Undergraduate Courses (< 500 level) 656 courses 1,380 sections 58,370 total enrollments 2,800 (5%) of enrollments are repeats 8,023 attempted enrollments (courses full)
Why Course Success Why Course Success
Impact on Retention, Graduation, and Y2D Impact on Retention, Graduation, and Y2D Avg. DFWI s by 2nd Year Retention Status Four Year Grad Rate by Total DFWI s Avg. DFWI s by Years to Degree 10.9 20% 7.17 13% 3.9 4.06 67% 2.3 1.62 0 1 2+ Retained Not Retained 4 Years 5 Years 6 Years 6+ Years
Impact at the Course Level Impact at the Course Level 2017-18 Lower Division LEC/SEM Courses 55 (16%) had a DFWI rate of 20% or higher 10,418 of the course enrollments were repeats 8,012 attempted enrollments received a course is full message REPEATS COURSE IS FULL DFWI s A lower division (major) course. DFWI rate of 21% 184 175 138
Machine Learning Approach Machine Learning Approach
Machine Learning Machine Learning A branch of artificial intelligence Learn from data Identify patterns Make decisions Application Examples Online recommendations Self-driving cars Fraud detection
Application Application IBM SPSS Modeler IBM SPSS Modeler (2018 CSU Innovation Minigrant) Powerful data mining software Accepts various data sources Visual interface without programing Language Automated modeling/model training Ability to apply trained models to a separate data
Data Data
Courses Examined Courses Examined ADMN ADMN BIOL BIOL MATH MATH PHIL PHIL Course Selection Lower Division High Enrollment High Failure Rate SSCI SSCI
Course Success Predictors Course Success Predictors Demographics (e.g., Sex & URM) Student Level Student Information Basis of Admission General Term Specific Course Information Instructor Information Degree Type (e.g., BA) College of Major Incoming GPA (i.e., HS & TR GPA) SAT & ACT Scores Developmental Math/Placement
Course Success Predictors Course Success Predictors Cumulative GPA Term Attempted Units Student Information Course Repeat/Highest Previous Grade General Term Specific Course Information Instructor Information # of High DFWI Courses (>25%) Average DFWI Rates # of Concurrent Courses with 10% Higher DFWI Rates When Taken Together
DFWI Rates by Math Course Sections DFWI Rates by Math Course Sections
Course Success Predictors Course Success Predictors Term (e.g., Fall) Student Information Campus (SB & Palm Desert) General Term Specific Course Information Instructor Information Meeting Days (e.g., MWF) Class Begin Time Instruction Mode (e.g., Online) Class Size
Course Success Predictors Course Success Predictors Student Information Tenure Status General Term Specific Course Information Instructor Information Previous Course Teaching Experience Average GPA Average DFWI Rates
Model Training Model Training
Results Results
Model Output Model Output Prediction Confidence 1 0.777777778 1 0.666666667 1 0.666666667 1 0.888888889 1 0.888888889 1 0.777777778 1 0.666666667 0 0.777777778 0 0.777777778 0 0.777777778 Prediction Prediction whether students are Student 155 Student 156 Student 157 Student 158 Student 159 Student 160 Student 161 Student 162 Student 163 Student 164 likely to receive DFWI (1=Yes, 0=No) Confidence Confidence how likely these predictions are correct (range: 0 to 1)
Model Prediction & Accuracy Model Prediction & Accuracy Historical (Summer 2015 to Summer 2018) Fall 2018 Predicted DFWI (n) Predicted DFWI (%) Actual DFWI (n) Actual DFWI (%) Overall Model Accuracy on Historical Data Predicted DFWI (n) Predicted DFWI (%) Course Enrollment Enrollment ADMN 2709 598 22% 641 24% 80% 133 39 29% BIOL 1276 629 49% 645 51% 77% 408 175 43% MATH 8363 2287 27% 2136 26% 81% 681 102 15% PHIL 653 267 41% 241 37% 79% 103 34 33% SSCI 3557 1004 28% 1231 35% 74% 407 84 21%
Top 5 Predictors (CHAID Model) Top 5 Predictors (CHAID Model) Rank ADMN BIOL MATH PHIL SSCI 1 Cumulative GPA Cumulative GPA Instructor DFWI Rate Cumulative GPA Cumulative GPA 2 Instructor DFWI Rate Student Level Cumulative GPA Instructor Average GPA Tenure Status 3 Tenure Status Dev. Math Tenure Status Dev. Math Grade Days College of Major 4 Class Size SAT Score Incoming GPA Concurrent CRS Term 5 Term URM Status Concurrent CRS Sex SAT Score
MATH Course Prediction by Section MATH Course Prediction by Section DFWI Prediction Total Predicted DFWI Rate Predicted DFWI Rate with > 60% Expected Accuracy Instructor Historical DFWI Section Yes 6 2 1 35 No 34 38 39 6 40 40 36 40 39 11 38 40 36 25 38 39 40 579 Enrollment 01 02 03 04 05 06 07 08 09 10 11 12 13 14 15 80 81 40 40 40 41 40 40 40 41 40 40 40 40 40 40 40 39 40 681 15% 5% 3% 85% 0% 0% 10% 2% 3% 73% 5% 0% 10% 38% 5% 0% 0% 15% 5% 0% 3% 76% 0% 0% 5% 0% 0% 38% 3% 0% 8% 20% 3% 0% 0% 9% 11% 9% 16% 43% 9% 0% 19% 5% 5% 43% 16% 15% 15% 34% 16% 8% 8% 16% 4 1 1 29 2 4 15 2 Total 102
Other Possible Report: Other Possible Report: MATH Student with Concurrent Course MATH Student with Concurrent Course Identified Concurrent Course Number of Concurrent Courses Student 234 Yes 1 Student 241 Yes 2 Student 267 Yes 1 Student 277 Yes 1 Student 278 Yes 1 Student 279 Yes 1 Student 280 Yes 1 Student 284 Yes 1 Student 287 Yes 1 Student 299 Yes 2
Next Steps Next Steps
Process Improvement Exploration and Automation Targeted Supplemental Instruction Advising Notify students where/when appropriate (e.g., concurrent courses) Reporting outputs and structures
