Power Distribution Analysis in Undulator Section

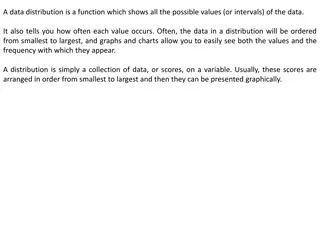
The study focuses on analyzing the power distribution on masks in an undulator section to determine if the mask design is adequate. Key parameters such as power deposition at the masks, on the inner surface of the undulators, and the need for a collimator in front of the target are examined. Assumptions and photon energy distributions on the target are considered, highlighting the power distribution on the masks and the radial distribution on the last mask.

Uploaded on Sep 15, 2024 | 1 Views
Download Presentation

Please find below an Image/Link to download the presentation.
The content on the website is provided AS IS for your information and personal use only. It may not be sold, licensed, or shared on other websites without obtaining consent from the author.If you encounter any issues during the download, it is possible that the publisher has removed the file from their server.
You are allowed to download the files provided on this website for personal or commercial use, subject to the condition that they are used lawfully. All files are the property of their respective owners.
The content on the website is provided AS IS for your information and personal use only. It may not be sold, licensed, or shared on other websites without obtaining consent from the author.
E N D
Presentation Transcript
Power Distribution on Masks in Undulator Section K.Yokoya 2017.6.1 Positron WG 2017/5/31 PositronWG, Yokoya 1
Motivation How high is the power deposited at the masks in the undulator section? Needed to see if the mask can be designed How high is the power deposited on the inner surface of the undulators? If further collimator is needed just in front of the target, how high is the deposit there as a function of the radius. (not actually done here) 2017/5/31 PositronWG, Yokoya 2
Assumptions 1312 bunches, 5Hz Ee= 128 125GeV Undulator L=1.75m, n=132 (n*L=231m), K=0.85 Optics FODO Distance between QF-QD (thin lens) = 12m Phase advance = 90deg 6 undulators between QF and QD Distance between undulator section center to target = 401.1m (compact dogleg by Okugi san) Mask at every quad. r=2.2mm (TDR) In some cases, collimator (r=2.2mm or larger) just in front of target Normalized emittance x=8 m, y=40nm No alignment errors 2017/5/31 PositronWG, Yokoya 3
Photons on the Target No Mask With Masks Masks & Coll. n / bunch 9.59x10¹² 8.01x10¹² 4.60x10¹² Average photon energy (MeV) 6.28 7.30 9.68 Power on target (kW) 63.4 61.5 46.7 Total Photon Power On masks 1.88 kW Average Electron Energy Loss 3.01GeV 2017/5/31 PositronWG, Yokoya 4
Photon Energy Distribution on Target x black: no mask red: with masks blue: with masks & collimator (r=2.2mm) 2017/5/31 PositronWG, Yokoya 5
Photon (x-y) Distribution on Target With masks See slightly larger horizontal size due to horizontal emittance Only randomly selected particles are plotted here Total number of macro particles is ~400k 2017/5/31 PositronWG, Yokoya 6
Power Distribution on Masks Maximum is at the last mask ~ 320 W 2017/5/31 PositronWG, Yokoya 7
Radial Power Distribution on the Last Mask Maximum ~100 W/mm2 2017/5/31 PositronWG, Yokoya 8
Photons Lost in Undulators Select photons lost at the last mask They might have been lost in undulators Distance between masks is 12m Find distribution of lost position rmask= 2.2mm, rundulator= 2.9mm Plot the power distribution macro particle n/bunch <E> (MeV) power 158. x1010 Photons lost in the whole undulator section 79459 1.13 1884 W 16.5 x10¹⁰ Photons lost at the last mask 8266 1.85 320 W 0.21 x10¹⁰ Photons lost between the last 2 masks 106 0.020 0.044 W 2017/5/31 PositronWG, Yokoya 9
Longitudinal Distribution of Photon Power Hitting the Undulator Maximum < 50 mW in one undulator Average photon energy ~20keV Statistics is a bit poor only ~100 particles 2017/5/31 PositronWG, Yokoya 10
Photon Data Photon data are stored in http://lcdev.kek.jp/~yokoya/temp/BeamOnTarget2017-0526.txt (survived photons on the target. no collimator. Contains some 400k photons) http://lcdev.kek.jp/~yokoya/temp/LostPhotons2017-0531.txt (lost photons. Lost position preserved, Contains some 80k photons) Format 1stline: title Then I2, 11X, 12E20.12 I2: 1 for photon, 2 for electron 12E20: w, t, x, y, s, E, px, py, ps, 1, 2, 3, w: 1 macro-particle represents w real particles : Stokes parameters 2017/5/31 PositronWG, Yokoya 11


 Distribution on Target")