Power Cable Trends in New and Emerging Markets
The global power cable market is witnessing significant developments driven by factors such as the transition to renewable energy, modernization of grid infrastructure, and commitments to reduce emissions. Countries like the US, EU, Germany, and China are making substantial investments in new technologies, aiming for carbon neutrality and renewable energy targets. The demand for power cables is expected to rise due to the increasing adoption of electric vehicles and distributed energy resources. This trend highlights the importance of adapting to new technologies and regulations in the power sector.
Uploaded on Jul 16, 2024 | 0 Views
Download Presentation

Please find below an Image/Link to download the presentation.
The content on the website is provided AS IS for your information and personal use only. It may not be sold, licensed, or shared on other websites without obtaining consent from the author.If you encounter any issues during the download, it is possible that the publisher has removed the file from their server.
You are allowed to download the files provided on this website for personal or commercial use, subject to the condition that they are used lawfully. All files are the property of their respective owners.
The content on the website is provided AS IS for your information and personal use only. It may not be sold, licensed, or shared on other websites without obtaining consent from the author.
E N D
Presentation Transcript
Power Cable in New and Emerging Markets 1
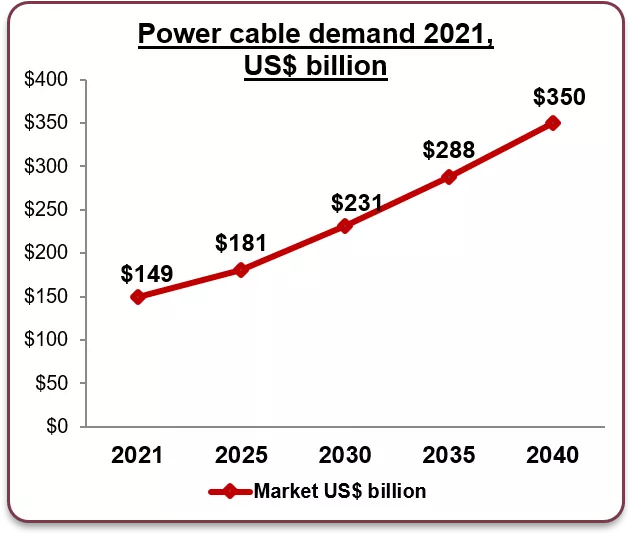
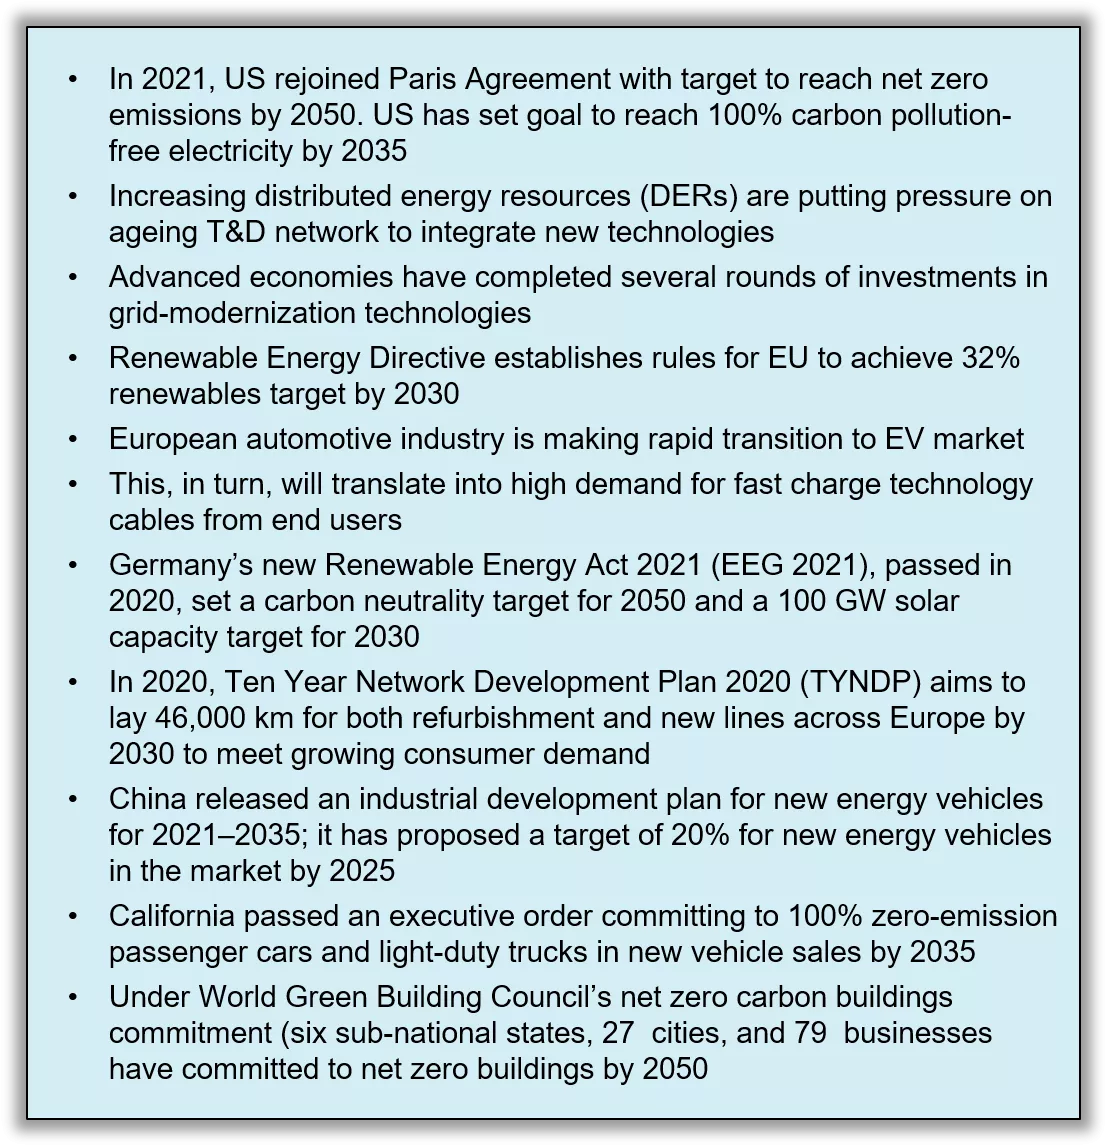
In 2021, US rejoined Paris Agreement with target to reach net zero emissions by 2050. US has set goal to reach 100% carbon pollution- free electricity by 2035 Increasing distributed energy resources (DERs) are putting pressure on ageing T&D network to integrate new technologies Advanced economies have completed several rounds of investments in grid-modernization technologies Renewable Energy Directive establishes rules for EU to achieve 32% renewables target by 2030 European automotive industry is making rapid transition to EV market This, in turn, will translate into high demand for fast charge technology cables from end users Germany s new Renewable Energy Act 2021 (EEG 2021), passed in 2020, set a carbon neutrality target for 2050 and a 100 GW solar capacity target for 2030 In 2020, Ten Year Network Development Plan 2020 (TYNDP) aims to lay 46,000 km for both refurbishment and new lines across Europe by 2030 to meet growing consumer demand China released an industrial development plan for new energy vehicles for 2021 2035; it has proposed a target of 20% for new energy vehicles in the market by 2025 California passed an executive order committing to 100% zero-emission passenger cars and light-duty trucks in new vehicle sales by 2035 Under World Green Building Council s net zero carbon buildings commitment (six sub-national states, 27 cities, and 79 businesses have committed to net zero buildings by 2050 Power cable demand 2021, US$ billion $400 $350 $350 $288 $300 $231 $250 $181 $200 $149 $150 $100 $50 $0 2021 2025 2030 2035 2040 Market US$ billion 2
Power cables are available in various load-carrying capacities and materials, and with varying voltage ranges; these can be installed either underground or overhead Power cables are divided into three cable types; they include high-, medium- and low-voltage cables Mainly used for transmission and distribution of electrical energy in power utilities, and for other applications In 2021, overall global power cable market was 8.7 million mt in volume terms Copper constitutes 54% of overall demand followed by aluminum with 46% Key factors driving growth Increase in demand for electricity coupled with increased population and urbanization Commitment from key countries towards implementing Paris agreement Rising trend of renewable energy generation around the globe Rise in switch from overhead lines to underground lines Replacement of older grid infrastructure Encouraging policies and initiatives of various governments and incentives 3
In 2021, China was the leading consumer of copper in power cables ROW leads in aluminum use followed by Europe, with ~62% and ~18% respectively Copper power cable market, by Region (kmt) Aluminum power cable market, by Region (kmt) 2,700 525 2,500 4,700 4,000 700 1,350 475 275 175 NA EU China ROW NA EU China ROW 4
According to the Paris Agreement, reducing energy-related CO emissions in every region across the globe is necessary to shift from consumption of fossil fuels that cause climate change to cleaner, renewable forms of energy Solar, along with wind energy and EV infrastructure, will play a critical role Solar Power In Solar PV cables is used for transmitting electrical power Cable is used to conduct electricity Heat exchangers are used to transfer solar energy Other emerging technologies 01 Smart city - transport mobility, energy, infrastructure, and smart buildings, data Centre Offshore wind power Cable within Tower Inter-connecting Towers (& to Farm step-up) Ground W&C Usage Cable from Tower to Pad Electronic and data transmission cable 05 02 EV Charging station Charging pad Vehicle charging points Cable Assembly Cord extension set Onshore wind power 04 03 Cable within Tower Inter-connecting Towers (& to Farm step-up) Ground W&C Usage Cable from Tower to Pad Electronic and data transmission cable 5
Global wind electricity systems installation is expected to reach ~2917 GW through 2040 China is expected to be the world leader in wind installation, reaching 1367 GW; followed by Europe ~590 GW Copper consumption is expected to reach 6.44 million mt through 2040 Windinstalledcapacity Copper consumption 3,000 7.00 6.00 2,500 5.00 Million mt 2,000 4.00 GW 1,500 3.00 1,000 2.00 500 1.00 0 0.00 2015 416 84 142 131 54 2015 416 84 142 131 54 2020 732 131 220 282 100 2020 732 131 220 282 100 2021 843 145 236 328 133 2021 843 145 236 328 133 2025 1200 210 10 536 169 2025 1200 210 10 536 169 2030 1750 290 405 800 255 2030 1750 290 405 800 255 2035 2140 375 500 925 340 2035 2140 375 500 925 340 2040 2500 460 590 1000 450 2040 2500 460 590 1000 450 2015 2020 0.98 0.19 0.33 0.31 2015 0.98 0.19 0.33 0.31 0.14 2020 2021 1.74 0.30 0.52 0.67 0.24 2021 2025 2.01 0.34 0.57 0.79 0.32 2025 2030 2.94 0.49 0.75 1.29 0.41 2030 2035 4.20 0.68 0.98 1.92 0.61 2035 2040 5.14 0.89 1.21 2.23 0.81 2040 5.99 1.08 1.43 2.41 1.08 Global NA EU China Others-a Global NA EU China Others-a Global NA EU China Others-a Global NA EU China Others-a 0.14 1.74 0.30 0.52 0.67 0.24 2.01 0.34 0.57 0.79 0.32 2.94 0.49 0.75 1.29 0.41 4.20 0.68 0.98 1.92 0.61 5.14 0.89 1.21 2.23 0.81 5.99 1.08 1.43 2.41 1.08 a-includes South America, Middle East, Asia Pacific excluding China, Africa, etc. 6
Global solar electricity systems installation is expected to reach ~5,700 GW through 2040 China is expected to be the world leader with ~2,230 GW followed by North America ~1,250 GW Copper demand is expected to reach ~6.41million mt through 2040 Copper consumption Solar installed capacity GW 7.00 6,000 6.00 Million mt 5.00 4,000 4.00 GW 3.00 2,000 2.00 1.00 0.00 0 2015 0.27 0.03 0.12 0.05 0.07 2015 0.27 0.03 0.12 0.05 2020 0.83 0.09 0.20 0.29 0.25 2020 0.83 0.09 0.20 0.29 0.25 2021 0.98 0.11 0.22 0.35 0.29 2021 0.98 0.11 0.22 0.35 0.29 2025 1.77 0.25 0.34 0.65 0.54 2025 1.77 0.25 0.34 0.65 0.54 2030 3.19 0.62 0.46 1.19 0.92 2030 3.19 0.62 0.46 1.19 0.92 2035 4.55 1.12 0.61 1.40 1.41 2035 4.55 1.12 0.61 1.40 1.41 2040 6.48 1.40 0.78 1.52 2.77 2040 6.48 1.40 0.78 1.52 2.77 2015 228 26 100 42 59 2015 228 26 100 42 59 2020 716 79 171 253 212 2020 716 79 171 253 212 2021 854 98 195 307 254 2021 854 98 195 307 254 2025 1550 225 300 559 466 2025 1550 225 300 559 466 2030 2800 550 420 1025 805 2030 2800 550 420 1025 805 2035 4000 1000 560 1200 1240 2035 4000 1000 560 1200 1240 2040 5700 1250 720 1300 2430 2040 5700 1250 720 1300 2430 Global NA EU China Others-a 0.07 Global NA EU China Others-a Global NA EU China Others-a Global NA EU China Others-a a-includes South America, Middle East, Asia Pacific excluding China, Africa, etc. 7
EV charging ports are expected to rise exponentially from 3.2 million in 2021 through 152 million through 2040 China is expected to be global leader in EV charging port infrastructure development; likely to reach 145 million ports Copper demand is expected to reach ~978 kit through 2040 from current use of 43 kmt in 2021 Copper consumption EV Charging Ports 14,000 140.00 12,000 120.00 000 units 10,000 100.00 000 mt 8,000 80.00 6,000 60.00 4,000 40.00 2,000 20.00 0 0.00 2015 115 30 35 40 10 2015 115 30 35 40 10 2020 1000 95 240 600 65 2020 1000 95 240 600 65 2021 1510 150 380 900 80 2021 1510 150 380 900 80 2025 2870 370 850 1300 350 2025 2870 370 850 1300 350 2030 4550 550 1600 1900 500 2030 4550 550 1600 1900 500 2035 8300 12400 1100 2600 3600 1000 2035 8300 1100 2600 3600 1000 2040 12400 1700 4000 5200 1500 2040 2015 1.15 0.30 0.35 0.40 0.10 2015 1.15 0.30 0.35 0.40 0.10 2020 10.00 15.10 0.95 2.40 6.00 0.65 2020 10.00 0.95 2.40 6.00 0.65 2021 15.10 28.70 1.50 3.80 9.00 0.80 2021 2025 28.70 45.50 3.70 8.50 13.00 3.50 2025 2030 45.50 83.00 5.50 16.00 19.00 36.00 5.00 2030 2035 83.00 124.00 11.00 26.00 40.00 36.00 52.00 10.00 2035 2040 124.00 17.00 40.00 52.00 15.00 2040 Global NA EU China Others-a Global NA EU China Others-a Global NA EU China Others-a Global NA EU China Others-a 1700 4000 5200 1500 1.50 3.80 9.00 0.80 3.70 8.50 13.00 19.00 3.50 5.50 16.00 26.00 11.00 17.00 5.00 10.00 15.00 a-includes South America, Middle East, Asia Pacific excluding China, Africa, etc. 8
SMART GRID:Smart grid generally refers to a class of technology used to bring utility electricity delivery systems using computer-based remote control and automation USA has allocated US$4.5 billion for grid modernization under the American Recovery Reinvestment Act of 2009 China s State Grid Corporation has outlined plans in 2010 for a pilot smart grid program; it maps out deployment through2030 Significant economies of scale in power grid construction and development have brought huge market demand and innovation to cable industry European countries like Italy, Spain, UK and France are upgrading meters and investing in smart grids features and modernizing networks Modernization with automation of grids is expected to drive copper consumption ENERGY STORAGE:The largest markets are USA, Western Europe and China. Market drivers are energy independence and security; smart grid investments; time of use/peak demand rates; growth in renewable and distributed generation; and government policies, incentives and regulations Due to copper s key core competitive advantages--reliability, efficiency, durability and safety, the metal is critical to the fundamental design of battery cells Copper is also important in the manufacture of Li-ion batteries At the cell level, copper is used in anode current collectors; at the pack level, it is used in electrical interconnects, for example bus bars, cables and wiring DATA CENTERS: Data centers are driven by growing demand for edge computing; this is a distributed computing framework that brings enterprise applications closer to data sources such as Internet of Things devices or local edge servers Large data centers and hyperscale data centers are the future for data storage in response to rising edge computing, smart cities, and increased use of smart phones and digitization Size of China s data center market in 2019 was US$ 13.01 billion; it is expected to reach US$ 36.18 billion in 2025 exhibiting a CAGR of 19.2% from 2020 to 2025 Increased demand for data centers will lead to infrastructure network expansion, which in turn, will drive copper consumption 9
B&C: Building and construction is expected to grow at 9-10% CAGR. Smart building adaptations will lead to increased copper consumption Green regulations in building standards like ASHRAE (USA), Eurocodes (EU), and voluntary certification such as LEED (US Green Building Council), Green Star (Australia), CASBEE (Germany), BREEAM (UK BRE) are likely to become increasingly strict, and also enforced Global demand for copper in climate-related commercial retrofitting market is likely to grow rapidly in response to growing adoption of green energy technologies and co-generation, HVAC efficiency, lighting efficiency, building envelopes, free cooling etc. Smart Cities: A smart city is an urban area that utilizes IoT sensors, actuators, and different types of electronic Internet of Things technology to connect components across the city. It impacts every layer of a city, from underneath the streets, to the air that citizens are breathing. Data from all segments is collected and analyzed, and then insights and patterns are detected to better manage assets, resources and services efficiently Asia and Europe currently lead the world in copper demand for use in smart cities, at 40% and 35% respectively North America has a market share of 20% By 2030, North America will have the highest growth and will be at par with Asia and Europe In China, smart cables are an indispensable in smart cities With the help of smart cities, a comprehensive intelligent management platform, the intelligent application of smart cables is likely to expand further with growing expansion and reliance of 5G networks on cables Arrival of 5G networks has increased reliance on some key components significantly, especially connectors and cables used in wireless and wired infrastructure Key sectors, including transport mobility, energy, infrastructure, and smart buildings, all use copper. As the adoption of new copper-based technologies increases, forecast shows copper demand in smart buildings will be a large growth area 10
Emerging technologies i.e. building & construction, RE, data centers, and EV are expected to drive overall copper demand through 2035 Building & construction and RE segments are expected to drive maximum growth among all emerging technologies Copper Demand Emerging Technology (kmt) 1,130 5,760 8,600 8,267 10,000 Data center B&C EV RE 5,000 0 2021 2025-e 2030-e 2035-e 2021 12 657 5 454 2025-e 70 3,864 14 1,812 2030-e 100 5,719 17 2,767 2035-e 103 5,777 38 2,350 Data center B&C EV RE e-estimated 11
Copper demand from power cables expected to reach 8.7 million at 4.5% CAGR through 2035 Aluminum, an alternative energy conductor, is expected to experience a slower growth, at 3.9% CAGR through 2035 Copper Demand Emerging Technology (kmt) 8,700 10,370 13,035 15,625 16,000 6,860 12,000 Aluminum 5,700 4,680 8,000 Copper 4,000 8,765 4,000 7,335 5,690 4,700 0 2021 2025-e 2030-e 2035-e e-estimated 12


