TA.YA ELECTRIC WIRE & CABLE CO., LTD. Overview & Financial Highlights
TA.YA ELECTRIC WIRE & CABLE CO., LTD., Stock Code: 1609, held its 2020 Q2 Investor Conference, outlining the group's overview, financial highlights, and core values. Established in 1955, the company focuses on power cable, magnet wire, telecom cable, optical fiber cable, bonding wire, and real estate. With a vision to become a leading brand in energy connection, TA.YA emphasizes continuous improvement and mutual benefits. The company's milestones include entering the renewable energy business and achieving certifications for environmental-friendly products.
Download Presentation

Please find below an Image/Link to download the presentation.
The content on the website is provided AS IS for your information and personal use only. It may not be sold, licensed, or shared on other websites without obtaining consent from the author. Download presentation by click this link. If you encounter any issues during the download, it is possible that the publisher has removed the file from their server.
E N D
Presentation Transcript
TA YA ELECTRIC WIRE & CABLE CO., LTD. Stock Code: 1609 2020 Q2 Investor Conference TA YA Group Overview & Financial Highlights Chen,Chung-Kuang Business Administration Group Deputy General Manager and Spokesperson 2020/9/11
DISCLAIMER The purpose of the briefing is to provide information, therefore will not be updated under any circumstances. TA YA Group does not have any responsibility to update or correct any information in this presentation. The information within the presentation does not hint future decisions or promise any solid validity.
AGENDA TAYA TAYA GROUP GROUP . TA YA Group Overview . Financial Highlights . IR Contact
TA YA Headquarter Found 1955 Capital NTD 5.951 billion Revenue NTD 18.15 billion ( 2019 Consolidated Results) Area 138,038 Employee : 625 Product : Power Cable / Magnet Wire / Telecom Cable / Optical Fiber Cable / Bonding Wire / Residential Properties and Office Buildings 5
Continuous improvements To become A leading brand in energy connection A creator of harmonious environment and pristine homeland A business trusted by employees, customers, shareholders, and society Business Philosophy Vision TA YA GROUP Core Values Philosophy Enlightened Employees, Continuous Improvements, Mutual Benefits, Pragmatism, Innovation & Changes. Satisfied Customers, Positive Shareholders, Pristine Homeland 6
Milestones 345kV power cables passed tests by TPC; environmental-friendly power cables were certified by EPA entered into the renewable energy business listed on the TWSE founded at Tainan 2012 2012 1986 1988 1995 2008 2014 1955 2020 Ta Ya 65th anniversary: the year of brand communication established Ta Ya Pristine relocated headquarter to Guanmiao 161kV power cables passed tests by TPC Homeland Foundation 7
TA YA Group Overview OVERVIEW OF GROUP Union Storage Energy System Co., Ltd. Amit System Service Co., Ltd. TA YA Innovation Investment Co., Ltd. HENG YA Electric (Kunshan) Ltd. TA YA Venture Capital Co., Ltd. UNITED Electric Industry Co., Ltd. CUPRIME Material Co., Ltd. HENG YA Electric Ltd. TA YA Electric Wire & Cable Co.,Ltd. TA HENG Electric Wire & Cable Co., Ltd. TA HO Engineering Co., Ltd. Ta Ya (Vietnam) Electric Wire & Cable Co., Ltd. AD Engineering Co., Ltd. TA YI Plastic Co., Ltd. TA YA Green Energy Technology Co., Ltd. Bosi Solar Energy Co., Ltd. Touch Solar Power Co., Ltd. Bravo Solar Power Co., Ltd. Sin Jhong Solar Power Co., Ltd. 8
Business Group Overview Energy & Telecom Cable Magnet Wires 9
Business Group Overview Bonding Wires Construction Business Group 10
A comprehensive system from 600V to 345kV has been set up. We are the first wire and cable company in Taiwan that develops the 345 kV system successfully and wins the engineering contract from TPC. Energy & Telecom Cable Business Group We also provide construction and maintenance services for cable lines. 11
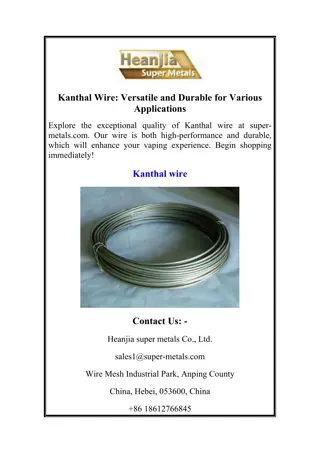
We have production bases in Taiwan, China, and Vietnam. Magnet wires have been sold domestically and overseas for more than Magnet Wire Business Group 40 years. Based on the professional production experience for many years, we gradually develop magnet wires, flat wires and TILWs of different characteristics. 12
The major products include copper bonding wires, au-pd coated copper wires, Bonding Wires Business Group and pd-coated bonding wires and are suitable for the IC packaging industry. 13
-Ta Ya Green Residence- Construction Business Group Total 14 units. 4 . 5F terrace house with elevator. 14
USESYS was founded in 2017 and joined venture between TAYA, Shilin and Cadmen. Major business Lithium Battery, Storage System, Key Parts R&D Electric Union Storage Energy System Co., Ltd. Storage Key Product and Technology EV Repurposing Battery Storage System 16
AMIT system service Ltd. was founded in Nov., 2016. We emphasize optimization of practical and knowledge services to assist parameterization, modularization and standardization for production technology of Taiwan industrial chain manufacturers by using software tool and cloud platform for global market. Our mission is to lead domestic motor industry into global proactive market. AMIT System Service LTD. Design Services Motor Design Motor Driving System Design Optimization of Power Electronic System Designs Solenoid Design Electromechanical Integration System Design Algorithm Design 17
TAYA Group First Year of Brand Communication Connect the World Moving Steady Forward 18
Financial Highlights Consolidated Statements of Income : June 30, 2020 Unit: Thousand of NTD, except for EPS in NTD Annual Growth Rate Quarterly Growth Rate Period 2020 Q2 2019 Q2 2020 Q1 Item Amounts % Amounts % Amounts % % % 8,173,709 100.0 8,958,863 100.0 3,957,011 100.0 (8.8) 106.6 Net Sales Operating Costs Gross Profit 7,640,515 93.5 8,239,984 92.0 3,695,318 93.4 (7.3) 106.8 533,194 6.5 718,879 8.0 261,693 6.6 (25.8) 103.7 Operating Expenses 476,782 5.8 450,604 5.0 224,561 5.7 5.8 112.3 56,412 0.7 268,275 3.0 37,132 0.9 (79.0) 51.9 Net Profit Non- Operational Income (Expenditure) Net Profit After Tax (Attributable to Shareholders of the Parent) EPS 528,692 6.5 21,457 0.2 202,794 5.1 2,364.0 160.7 457,902 5.6 209,848 0.36 2.3 139,807 0.24 3.5 118.2 227.5 0.78 20
Financial Highlights Consolidated Statements of Income : April,31~June 30, 2020 Unit: Thousand of NTD, except for EPS in NTD Annual Growth Rate Quarterly Growth Rate Period Apr.~ Jun. 2020 Apr.~ Jun. 2019 Jan.~Mar. , 2020 Amounts % Amounts % Amounts % % % Item Net Sales 4,216,698 100.0 4,489,345 100.0 3,957,011 100.0 (6.1) 6.6 Operating Costs 3,945,197 93.6 4,161,922 92.7 3,695,318 93.4 (5.2) 6.8 Gross Profit Operating Expenses Net Profit or Loss Non- Operational Income (Expenditure) Net Profit After Tax 271,501 6.4 327,423 7.3 261,693 6.6 (17.1) 3.7 252,221 6.0 224,590 5.0 224,561 5.7 12.3 12.3 19,280 0.5 102,833 2.3 37,132 0.9 (81.3) (48.1) 325,898 7.7 34,687 0.8 202,794 5.1 839.5 60.7 318,095 7.5 95,591 2.1 139,807 3.5 232.8 127.5 EPS 0.54 0.17 0.24 - - 21
Financial Highlights Consolidated Statements of Income : April,31~June 30, 2020 Unit: Thousand of NTD, except for EPS in NTD Annual Growth Rate Quarterly Growth Rate Period Apr.~ Jun. 2020 Apr.~ Jun. 2019 Jan.~Mar. , 2020 ITEM Amounts % Amounts % Amounts % % % Net Sales 4,216,698 100.0 4,489,345 100.0 3,957,011 100.0 (6.1) 6.6 Operating Costs 3,945,197 93.6 4,161,922 92.7 3,695,318 93.4 (5.2) 6.8 Gross Profit 271,501 6.4 327,423 7.3 261,693 6.6 (17.1) 3.7 Operating Expenses Net Profit 252,221 19,280 6.0 0.5 224,590 102,833 5.0 2.3 224,561 37,132 5.7 0.9 12.3 (81.3) 12.3 (48.1) Non-Operational Income 325,898 7.7 34,687 0.8 202,794 5.1 839.5 60.7 Net Profit After Tax (Attributable to Shareholders of the Parent) 318,095 7.5 95,591 2.1 139,807 3.5 232.8 127.5 EPS 0.54 0.17 0.24 - - 22
Financial Highlights Annual Operating Performance 20,000.00 10.00% 9.26% 9.00% 15,000.00 8.00% 7.21% 7.19% 7.00% 6.89% 6.52% 10,000.00 6.00% 5.00% 5,000.00 4.00% 3.12% 3.00% 0.00 2.00% 104Y 105Y 106Y 107Y 108Y 109Q2 1.00% (5,000.00) 0.00% Sales Net Profit After Tax (Attributable to Shareholders of the Parent) Rate of Gross Profit Unit: Thousand of NTD 23
Financial Highlights Operating Performance Per Share Unit: NTD Item / Year 2015 2016 2017 2018 2019 2020Q2 Earnings Per Share (0.97) 0.05 0.83 0.83 0.86 0.78 Cash Dividend Per Share 0 0 0.35 0.3 0.3 0 Stock Dividend Per Share 0 0 0 0.4 0 0 Return on Equity -7.97% 0.44% 7.15% 7.15% 7.09% 6.47% Net Value Per Share 11.34 11.17 11.27 11.11 11.62 12.25 Operating Cash Flow Per Share 0.95 0.19 (0.33) 0.75 1.02 1.94 24
Financial Highlights Consolidated Statements of Financial Position: Unit: Million of NTD Period Jun.30, 2020 Jun.30, 2019 Mar. 31, 2020 Assets Assets Current Assets Amounts % Amounts % Amounts % 3,036 14.5 3,645 17.03 Cash and Cash Equivalents 2,921 13.27 Financial Assets at Fair Value through Profit or Loss - Current Financial Assets at Fair Value through other comprehensive income 572 2.6 380 1.81 629 2.94 24 0.11 4 0.02 20 0.09 Financial Assets at Amortized Cost - Current 244 1.11 189 0.9 206 0.96 Contract Assets-Current 63 0.29 0.89 298 222 1.42 1.06 131 0.61 281 1.31 Net Notes Receivable 195 2,751 13.14 2,409 11.25 Net Accounts Receivable 2,608 11.85 3,520 775 16.81 3.7 3,125 14.6 744 3.48 Inventory Other Current Assets 3,110 313 14.13 1.42 11,175 53.36 11,19052.27 Total Current Assets 10,050 45.67 25
Financial Highlights Consolidated Statements of Financial Position: Unit: Million of NTD Period Assets Jun.30, 2020 Jun.30, 2019 Mar. 31, 2020 Assets Non-Current Assets Financial Assets at Fair Value through Profit or Loss - Non-Current Amounts % Amounts % Amounts % 1,728 7.85 1,159 5.53 1,453 6.79 Financial Assets at Fair Value through OCI - Non-Current 909 4.13 791 3.78 870 4.06 Investments Accounted for Using Equity Method 793 5,413 3.6 820 4,762 3.92 22.74 787 4,837 3.68 22.6 24.59 Property, Plant And Equipment 458 2.08 430 2.05 465 2.17 Right-of-Use Asset 1,101 5 1,104 5.27 1,103 5.15 Investment Property-Net 1,559 7.08 703 3.35 699 3.28 Other Non-Current Assets 11,961 54.33 9,769 46.64 10,214 47.73 Total Non-Current Assets 22,011 100.00 20,944 100.00 21,404 100.00 Total Assets 26
Financial Highlights Consolidated Statements of Financial Position: Unit: Million of NTD Period Liability Jun.30, 2020 Jun.30, 2019 Mar. 31, 2020 Liability and Equity Liability Amounts % Amounts % Amounts % Current Liability 4,502 20.45 3,739 17.85 4,216 19.7 Short-term Debt 590 2.68 760 3.63 755 3.53 Short-term Notes And Bills Payable Financial Liabilities At Fair Value Through Profit Or Loss - Current 2 0.01 28 0.13 104 0.47 152 0.69 157 0.75 195 0.91 Contract Liability-current Notes Payable 75 0.34 57 0.27 71 0.33 584 2.65 530 2.53 500 2.34 Accounts Payable Provisions 120 0.55 113 0.54 113 0.53 Leased Liability 17 0.08 19 0.09 19 0.09 1,067 4.85 2,004 9.57 1977 9.24 Current portion of long-term loans 1,280 5.82 627 2.99 521 2.43 Other Current Liabilities 8,491 38.58 8,008 38.23 8,395 39.23 27 Total Current Liabilities
Financial Highlights Consolidated Statements of Financial Position: Unit: Million of NTD Period Liability Jun.30, 2020 Jun.30, 2019 Mar. 31, 2020 Non-Current Liabilities Amounts % Amounts % Amounts % Financial Liabilities at Fair Value through Profit or Loss Non- Current 0 0 0 0 9 0.04 500 2.27 500 2.39 500 2.34 Bonds Payable 3,734 16.96 3,634 17.35 3,263 15.24 Long-Term Loans 223 1.01 196 0.94 229 1.07 Leased Liabilities 432 1.96 479 2.29 437 2.04 Other Non-Current Liabilities 4,889 22.2 4,809 22.97 4,438 20.73 Total Non-Current Liabilities 13,380 60.78 12,817 61.2 12,833 59.96 Total Liabilities 28
Financial Highlights Consolidated Statements of Financial Position: Unit: Million of NTD Period Equity Jun.30, 2020 Jun.30, 2019 Mar. 31, 2020 Equity Amounts % Amounts % Amounts 28.41 2.52 2.43 -0.47 -0.1 % 5,951 531 1071 -177 -85 27.04 2.41 4.87 -0.8 -0.39 5,951 527 508 -96 -21 5,951 531 931 -192 -33 27.8 2.48 4.35 -0.9 -0.15 Common Share Capital Total Additional Paid In Capital Total Retained Earnings Total Other Equity Treasury Shares Consolidated Net Income Attributed to Stockholders of the Company 7,291 33.13 6,869 32.79 7,188 33.58 Non-controlling Interest 1,340 6.09 1,258 6.01 1,384 6.46 8,631 39.22 8,127 38.80 8,572 40.04 Total Equity 22,011 100 20,944 100 21,405 100 Total Liabilities and Equity 595,068,022 572,180,791 595,068,022 Number of Shares (Unit: Share) 29
Financial Highlights Sales Volume Of Various Products: 45,000 40,000 35,000 30,000 Other Magnet Wires 25,000 Telecom Cable 20,000 Energy Cable Copper Wire 15,000 Total 10,000 5,000 - 108 109 Q2 104Y 105Y 106Y 107Y Sales Volume : Ton 30
Financial Highlights Subsidiaries Net Income: 2019Q2~2020Q2 Unit: Thousand of NTD Subsidiaries 2020 Q2 Net Income 2019 Q2 Net Income (72,402) (47,994) TA YA (CHINA) HOLDING LTD. 12,953 (22,471) TA YA VENTURE HOLDINGS LTD. TA YA (Vietnam) INVESTMENT HOLDING LTD. 14,632 35,797 TA YA INNOVATION INVESTMENT CO., LTD. 36,074 15,382 0 0 TA YA ELECTRIC WIRE &CABLE (H.K.) 123,091 79,892 TA YA VENTURE CAPITAL CO., LTD. TA HENG ELECTRIC WIRE & CABLE CO., LTD. TA HO ENGINEERING, CO., LTD. 19,191 17,312 (455) 4,987 TA YI PLASTIC CO., LTD. CUPRIME MATERIAL CO., LTD. UNITED ELECTRIC INDUSTRY CO., LTD. 1,499 (34,935) 107,917 2,645 (32,227) 20,395 207,565 73,718 31 Subtotal
Financial Highlights Subsidiaries Net Income: 2019Q2~2020Q2 Unit: Thousand of NTD Subsidiaries 2020 Q2 Net Income 2019 Q2 Net Income 207,565 73,718 Continued from the previous page Union Storage Energy System Ltd. 0 (7,118) 6,811 9,642 PLASTIC TECHNOLOGY INVESTMENT HOLDING 21,592 11,030 TA YA Green Energy Technology co., LTD. (3,856) (3,414) AMIT system service LTD. 32,727 10,148 Ad Engineering Corporation (118,541) 44,706 Hengs Technology Co., Ltd. 54,650 40,668 Jung Shing Wire Co., Ltd. 146,298 179,380 Subsidiaries Net Income 32
. IR Contact Spokesman : CHEN,CHUNG-KUANG Add : No.249, Sec. 2, Chung Shan Rd., KuanMiao Dist, Tainan CITY 71847, Taiwan (R.O.C.) E-mail : ck_chen@mail.taya.com.tw TEL : +886-6-5953131#250 FAX : +886-6-5958190 33
