Performance Simulations
This presentation explores simulations on distributing video content in a stadium setting, focusing on coverage per access point, assumptions regarding spectators, unicast vs. broadcast traffic, cell size estimation, error rate measurements, and performance results under various conditions.

Download Presentation

Please find below an Image/Link to download the presentation.
The content on the website is provided AS IS for your information and personal use only. It may not be sold, licensed, or shared on other websites without obtaining consent from the author.If you encounter any issues during the download, it is possible that the publisher has removed the file from their server.
You are allowed to download the files provided on this website for personal or commercial use, subject to the condition that they are used lawfully. All files are the property of their respective owners.
The content on the website is provided AS IS for your information and personal use only. It may not be sold, licensed, or shared on other websites without obtaining consent from the author.
E N D
Presentation Transcript
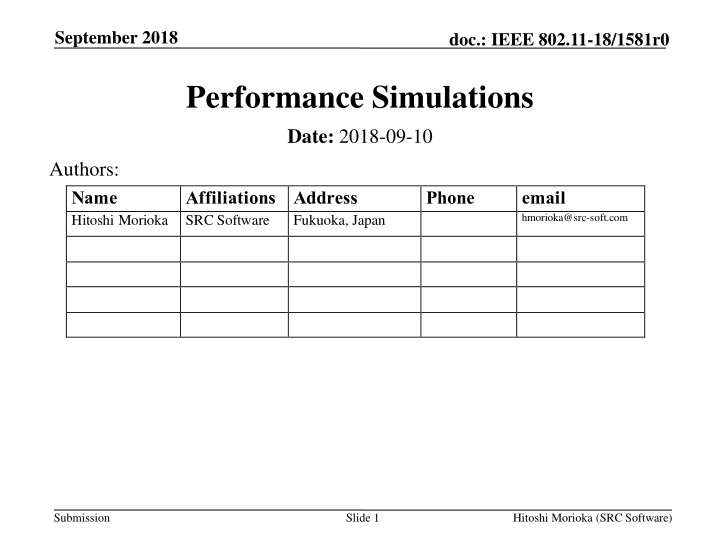
September 2018 doc.: IEEE 802.11-18/1581r0 Performance Simulations Date: 2018-09-10 Authors: Name Hitoshi Morioka Affiliations Address SRC Software Phone email hmorioka@src-soft.com Fukuoka, Japan Submission Slide 1 Hitoshi Morioka (SRC Software)
September 2018 doc.: IEEE 802.11-18/1581r0 Abstract This presentation describes the stadium video distribution simulations. Especially the point of view of: How many device can be covered by a single AP? Submission Slide 2 Hitoshi Morioka (SRC Software)
September 2018 doc.: IEEE 802.11-18/1581r0 Assumptions Tens of thousands of spectators in a stadium Each spectator occupies 1m2 (1m * 1m) All spectators watch the same video stream on their own devices. A video stream consumes 2Mbps 1m 1m Submission Slide 3 Hitoshi Morioka (SRC Software)
September 2018 doc.: IEEE 802.11-18/1581r0 Unicast vs Broadcast Unicast traffic is proportional to the number of users Broadcast does not have ACK mechanism. A kind of inter-packet error correction will be used to reduce packet losses. e.g. transmitting the same packet multiple times. traffic (Mbps) Broadcast (3 times) Broadcast (2 times) Broadcast (1 time) number of users Submission Slide 4 Hitoshi Morioka (SRC Software)
September 2018 doc.: IEEE 802.11-18/1581r0 Cell Size Estimation To specify the practical cell size, Measured error rate Calculated cell size Submission Slide 5 Hitoshi Morioka (SRC Software)
September 2018 doc.: IEEE 802.11-18/1581r0 Error Rate Measurement Host A and Host B exchange packets. Payload: 1408 byte Host C captures packets. If FCS is incorrect, the frame is considered as error. Not in a shielded room, just in a general office building. Much interference AP Host A Host B Stable Communication Capture Host C Move Submission Slide 6 Hitoshi Morioka (SRC Software)
September 2018 doc.: IEEE 802.11-18/1581r0 Result N > 1000 for each point 2.4GHz MCS 7 (n) ShortGI 20MHz Bandwidth 72.2 Mbps The result may be affected by interference from environment. 5.2 GHz MCS 7 (ac) ShortGI 80MHz Bandwidth 325.0 Mbps Error Rate Error Rate 0 ~ RX Power (dBm) when RX Power > -67dBm Submission Slide 7 Hitoshi Morioka (SRC Software)
September 2018 doc.: IEEE 802.11-18/1581r0 Cell Size Assumptions TX power: 1mW or 10mW Antenna Gain: 0dBi Free Space (Friis transmission equation) Frequency (GHz) RX Power (dBm) 2.4 5.2 TX Power (mW) 1 10 1 10 Distance (m) when RX Power = -67dBm 22 70 10 35 -67 Area (m2) = Number of Users 1558 15579 332 3319 An AP can cover > 3000 users while existing IEEE 802.11 AP can associate with 2007 STAs. Distance (m) Submission Slide 8 Hitoshi Morioka (SRC Software)
September 2018 doc.: IEEE 802.11-18/1581r0 Conclusion Broadcast can reduce traffic when many users access to the same contents. Broadcast without association can reduce the number of APs for Broadcast Service. Submission Slide 9 Hitoshi Morioka (SRC Software)