Parabola Party: Exploring Quadratic Functions
Join the Parabola Party hosted by Quadratic Functions! Discover the domain and range of quadratic functions, understand the standard form, and explore the vertical stretch of parabolic shapes. Unravel the secrets of parabolas opening up or down, and ride the mathematical train through the x-axis domain. Dive into the world of quadratic functions with exciting visuals and engaging content.

Download Presentation

Please find below an Image/Link to download the presentation.
The content on the website is provided AS IS for your information and personal use only. It may not be sold, licensed, or shared on other websites without obtaining consent from the author.If you encounter any issues during the download, it is possible that the publisher has removed the file from their server.
You are allowed to download the files provided on this website for personal or commercial use, subject to the condition that they are used lawfully. All files are the property of their respective owners.
The content on the website is provided AS IS for your information and personal use only. It may not be sold, licensed, or shared on other websites without obtaining consent from the author.
E N D
Presentation Transcript
Parabola Party: Hosted by Quadratic Functions, All Others Welcome! MATH II UNIT 1 Come On Ride The Train!
The train is my DOMAIN! This train travels from left to right along the x- axis. Our domain is the set of all x-values that are covered by the function.
The DOMAIN of any quadratic function is all real numbers. Another way to write this is from (- , ).
The RANGE of a quadratic function in the upright position goes from the y-value of the vertex to . The RANGE of a quadratic function in the downward goes from - to y-value of vertex.
How low can you go? RANGE is read from bottom to top and is on the y-axis. How high can you fly?
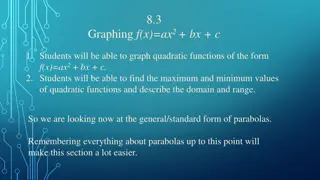
Standard form of a Quadratic Function y = ax2 + bx + c
Shape of a quadratic function The shape of a quadratic is a parabola. It can open up or down.
Vertical Stretch y = x2 y = 3x2 The vertical stretch is caused by the a value being greater than 1. It will make the graph look tall and skinny when compared to the parent function.
Vertical Shrink y = x2 y = 0.5x2 The vertical shrink is caused by the a value being between 0 and 1 (fraction or decimal with no whole part). It will make the graph look short and fat when compared to the parent function.
Vertical Shift y = x2 y = x2 + 3 y = x2 - 3 The vertical shift is caused by a value being added or subtracted to the parent function equation. It will make all points move up or down from the original points of the parent function.
Reflection across the x-axis y = x2 y = -x2 The reflection across the x-axis is caused by a negative being placed in front of the a value. When compared to the parent function, all values are the opposite of the parent function values.
Multiple Transformations in a Graph y = x2 y = 2x2 - 1 Compare the two equations. What was changed from the parent function to the new function? We know that the 2 before the x2 causes the graph to become tall and skinny because it is a vertical stretch. The 1 being subtracted from the x2 causes the graph to move down one unit because it is a vertical shift down.
Multiple Transformations in a Graph y = x2 y = -0.5x2 + 3 Compare the two equations. What was changed from the parent function to the new function? Discuss with your partner the transformations seen in the red function.
Skill Sheet Example Set 1 y = x2 + 1 Explanation: y = 3x2 2 Explanation: y = 0.2x2 1 Explanation: