Overview of Radiography and Ultrasound Imaging Techniques
This content provides a comprehensive overview of conventional radiography, digital radiography, and ultrasound imaging techniques. It covers equipment details, safety issues, advantages vs. limitations, as well as the interpretation, magnification, and integration capabilities of these imaging modalities. The content also delves into the different types of ultrasound imaging and the components of ultrasound systems.
Download Presentation

Please find below an Image/Link to download the presentation.
The content on the website is provided AS IS for your information and personal use only. It may not be sold, licensed, or shared on other websites without obtaining consent from the author.If you encounter any issues during the download, it is possible that the publisher has removed the file from their server.
You are allowed to download the files provided on this website for personal or commercial use, subject to the condition that they are used lawfully. All files are the property of their respective owners.
The content on the website is provided AS IS for your information and personal use only. It may not be sold, licensed, or shared on other websites without obtaining consent from the author.
E N D
Presentation Transcript
Dr Rudra Pratap Pandey Prof. VSR
1. Conventional radiography 2. Digital radiography (CR & DR) A. Equipment details B. Safety issues Radiation c. Advantages vs limitations d. Analog vs HF
1.Air/gas: black, e.g. lungs, bowel and stomach 2.Fat: dark grey, e.g. subcutaneous tissue layer, retroperitoneal fat 3.Soft tissues/water: light grey, e.g. solid organs, heart, blood vessels, muscle and fluid-filled organs such as bladder 4.Bone: off-white 5.Contrast material/metal: bright white.
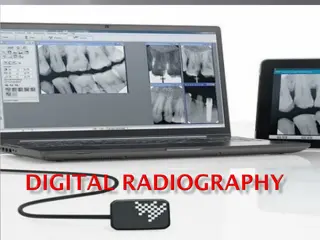
Computed radiography (CR) employs cassettes that are inserted into a laser reader following X- ray exposure. An analogue-digital converter (ADC) produces a digital image with the help of computer. Direct digital radiography (DR) uses a detector screen containing silicon detectors that produce an electrical signal when exposed to X-rays. This signal is analysed to produce a digital image. Digital images obtained by CR and DR are sent to viewing workstations for interpretation. Images may also be recorded on X-ray film for portability and remote viewing 1. 2. 3.
1. Magnification of areas of interest (Fig. 1.2) 2. Alteration/optimization image attributes 3. Measurements of distances and angles 4. Integration with PACS (with US/CT/MR images) 5. Cost of establishment
Types as per need A mode B Mode M Mode Doppler Ultrasound
Transducer or Probeas generator + sensor 1. Arrangement of Piezoelectric crystals 2. Frequency 3. Footprint or aperture
A. Transducer or Probeas generator + sensor 1. Arrangement of Piezoelectric crystals 2. Frequency 3. Footprint or aperture size B. Computer for analyzing the US signals C. Control Panel (Knobology?!) D. Display unit CRT/TFT/LCD
A. Convex or Curved (Regular or Microcovex) 1. Crystal arrangement is curvilinear 2. Available with fixed or variable frequency 3. Footprint is large convex 4. Image area is diverging convex of variable size 5. Of most versatile use
B. Linear 1. Crystal arrangement is parallel 2. Available with high frequency 3. Footprint is small 4. Image area is rectangle or variable size 5. Mainly used for superficial structures, tendons, muscles, vessles
C. Phased Array 1. Crystal arrangement is parallel time delay effect allows steering 2. Available with 2-7.5 mHz frequency 3. Footprint is very small 4. Image area is almost a traingle of variable size poor resolution in near field 5. Mainly used for cardiac (high frame rate) and brain examination
Special types based on the shape: 1. Side firing linear or convex 2. Pencil or front firing 3. Endocavity side or front firing 4. Transesophageal 5. Endoscopic 6. Motorized 3D or Volume Probe
1. Pulse echo 2. Amplitude vs brightness 3. Transmission / Reflection / enhancement / attenuation 4. Sojourn through tissue interfaces 5. Artifacts acoustic enhancement / shadowing / reverberations
1. Principles 2. Types Pulse wave (Doppler gate in vessel frequency shift displays as graph), Color (different color coding for blood flowing towards and away from probe) 3. Clinical applications (vessels .valves)
1. Post acquisition 3D image reconstruction 2. Real time dynamic 3D image 3. Purpose specific applications
1. Use of non radiant energy 2. Non invasive 3. Purpose specific applications
The patient is passed through a rotating gantry that has an X-ray tube on one side and a set of detectors on the other. Helical scanners Multidetector row CT (MDCT) 8, 16, 32 256 n more allow good scanning speed, continuous data for 3D image reconstruction (CT angiography) Cross-sectional (transverse / coronal / saggital) images of desired width (slices of part) are obtained. Image reconstructed with computer. The relative density of an area of interest may be measured electronically. Window setting bone or brain n further e.g. Mediastinal (no lung parenchyma) or lung (good lung parenchyma) Tissue density is measured in attenuation value (HU). Air to bone HU. Tissue density is measured in attenuation value (HU). Air to bone HU difference -1k to +1k 1. 2. 3. 4. 5. 6.
Superior quality images of great diagnostic value, study of malignancies High cost of equipment High dose of ionizing radiation Possible side effects of contrast agents if used Equipment non portability
application of a strong, external magnetic field (0.3 tesla and above) The hydrogen atoms within the patient align in a direction either parallel or antiparallel to the strong external field. A greater proportion aligns in the parallel direction so that the net vector of their alignment, (net magnetic vector) will be in the direction of the external field. This is known as longitudinal magnetization. A second magnetic field (radiofrequency pulse - RF pulse) is applied at right angles to the original external field. The RF pulse causes the net magnetization vector of the hydrogen atoms to turn towards the transverse plane. 1. 2. 3. 4. 5.
Chamber: inside the main magnet generating the external magnetic filed B0 to align the magnetic moments of hydrogen atoms Correcting coils induce an additional magnetic field compensating for the non- uniformities of the B0filed Gradient coils to produce the linear field change (gradient) Forcing and receiving coils
Physical basis: some atomic nuclei have a spin and exhibit a magnetic moment Mainly uses hydrogen analysis: the generation of electromagnetic radiation by hydrogen atom nuclei (protons) in the organism is analyzed The natural atoms have to be appropriately excited Applies a strong magnetic field for imaging This field causes the nuclei of atoms to be aligned and spatially oriented When an external impulses comes to excite them, they respond with a harmonious tune, giving a clear and easily recordable signal revealing where they are abundant and where less. Magnetic field intensity: 0.1-3.0 Telsa
External B0 field produces defined magnetization M Electromagentic impulse of a specific, defined frequency (Larmor frequency 0) is applied with direction perpendicular to M and B0 A nuclear resonance occurs: the M vector transits to the plane perpendiculr to B0 All individual nuclei spin after the excitation, in the transverse plane, at the same frequency 0 and in consistent phases The relationship between 0 and the type of nucleus means that an impulse of the right frequency will excite only one type of nuclei The receiving coil (if placed at the vicinity of the excited tissue) will receive the current with 0 (transverse component of M) as a signal that allows an image of the tissue to be examined
Principle of signal acquisition Before excitation: transverse M (Mt) = 0 At the moment of excitation: longitudinal M (M1) = 0 Relaxation: Longitudinal M is restored (T1: time for M1 return 63%) Transverse M decays to 0 (T2: time for Mt vanish 63%)
MRI makes use of sequences of stimulating impulses TR (time of repetition) TE (time of echo)
T1 weighted images: difference of T1 Tissue with shorter T1 has longer M magnetization length following the impulse, therefore brighter image TR is the key parameter: can not be too long Short TR and TE are used T2 weighted images: difference of T2 Tissue with longer T2 gives relatively stronger signal after appropriate TE time TE is the key parameter: can not be short Long TR and TE are used Proton density weighing (PD) Based on differences in the density of protons in difference tissues, disregard the differences in T1 & T2 Long TR & short TE
CT shows better anatomical details, MRI differentiates tissue of different biological functions better.
