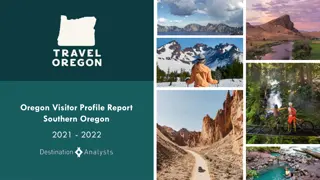
Oregon Visitor Profile Report: Portland Region 2021-2022
This report presents findings of a study conducted by Destination Analysts on behalf of Travel Oregon to develop a profile of Oregon visitors, understand their travel behaviors, motivations, and in-destination activities, and provide data to support visitor volume estimates. The study involved online surveys of U.S. travelers, Travel Oregon partners' owned audiences, and Portland International Airport WiFi users who visited Oregon between January 2021 and December 2022. The report covers research overview, methodology, sample details, visitor summary, trip details, activities, perceptions, satisfaction, trip planning, markets, and demographics.

Download Presentation

Please find below an Image/Link to download the presentation.
The content on the website is provided AS IS for your information and personal use only. It may not be sold, licensed, or shared on other websites without obtaining consent from the author.If you encounter any issues during the download, it is possible that the publisher has removed the file from their server.
You are allowed to download the files provided on this website for personal or commercial use, subject to the condition that they are used lawfully. All files are the property of their respective owners.
The content on the website is provided AS IS for your information and personal use only. It may not be sold, licensed, or shared on other websites without obtaining consent from the author.
E N D
Presentation Transcript
Oregon Visitor Profile Report Portland Region 2021 - 2022
CONTENTS Research Overview & Methodology 3 Visitor Summary 7 Trip Details 12 Visitor Activities 32 Perceptions & Satisfaction 45 Trip Planning 58 Markets & Demographics 61
RESEARCH OVERVIEW This report presents the findings of a study of travelers to Oregon, conducted by Destination Analysts on behalf of Travel Oregon. The study was conducted in three parts, with the primary objectives of: Developing a profile of Oregon visitors, including their psychographics, travel personas, and demographics Understand their travel behaviors and motivations, as well as in-destination activities and spend Provide data to support Oregon visitor volume estimates by region and segment Gauge visitors in-destination experience and identify what is successful, what can be added, and what can be improved
RESEARCH METHODOLOGY The three components of the study include: 1. Online panel survey of U.S. travelers who visited Oregon between January 2021 December 2022 2. Online survey of Travel Oregon partners owned audiences who visited Oregon between January 2021 December 2022 3. Online survey of Portland International Airport s WiFi users who visited Oregon between January 2022 December 2022 The data is weighted according to Travel Oregon s specifications, including regions visited within Oregon.
RESEARCH SAMPLE The three components of the study include: Travel Oregon Partners Owned Audience Survey (Out of State & In State Visitors) National Online Panel Survey (Out of State Visitors Only) PDX Airport Passenger Survey (Out of State & In State Visitors) Wave 1 Fielding Dates December 2021 January 2022 January March 2022 February 2022 Sample Collection 802 3,197 827 Travel Period Covered January 2021 December 2022 January 2021 December 2022 January 2021 December 2022 Wave 2 Fielding Dates May June 2022 May June 2022 May 2022 Sample Collection 805 976 2,721 Travel Period Covered January 2021 June 2022 January 2021 June 2022 January 2021 December 2022 Wave 3 Fielding Dates September October 2022 September October 2022 July August 2022 Sample Collection 805 669 3,277 Travel Period Covered January 2021 September 2022 January 2021 September 2022 January 2021 December 2022 Wave 4 Fielding Dates December 2022 January 2023 December 2022 January 2023 November December 2022 Sample Collection 805 1,247 1,631 Travel Period Covered January 2021 December 2022 January 2021 December 2022 January 2021 December 2022
DEFINITIONS Total/Statewide Visitors any visitors who traveled to or within Oregon between 2021 2022. Portland Region Visitors any visitors who traveled to the Portland region between 2021 2022. Oregon Coast Visitors any visitors who traveled to the Oregon Coast region between 2021 2022. Central Oregon Visitors any visitors who traveled to the Central Oregon region between 2021 2022. Southern Oregon Visitors any visitors who traveled to the Southern Oregon region between 2021 2022. Mt. Hood/Columbia River Gorge Visitors any visitors who traveled to the Mt. Hood/Columbia River Gorge region between 2021 2022. Eastern Oregon Visitors any visitors who traveled to the Eastern Oregon region between 2021 2022. Note all questions in the study were asked about statewide travel. Responses by region are representative of visitors who went to the specified region but are not specific to the region itself.
PORTLAND REGION VISITORS Summary DEMOGRAPHICS Visitors to Portland in 2021-2022 averaged 49 years of age, skewed somewhat female (58%), were usually married/partnered (71%), and reported high average household incomes ($119,757). One quarter had children in their household (27%). Most identified as White/Caucasian (80%). One-in-six had accessibility needs (16%). TRIP PURPOSE Half of these Portland visitors were taking a vacation/leisure trip (47%). Most remaining visitors came to visit friends/family (25%) or for business (14%). More than four-in-five had been to Oregon before (83%); therefore, relatively few were visiting the state for the first time (17%). Portland visitors positioned scenic beauty (89%) and a relaxing environment (88%) as the top important factors for choosing Oregon in 2021-2022. Local food/cuisine (84%), an inclusive/welcoming atmosphere (82%), and affordability/value (82%) round out the top five. TRIP DETAILS Portland visitors spent an average of 5.9 days on their Oregon trip in 2021-2022. While they all visited Portland, many ventured to other parts of the state. More than a third spent time along the Oregon Coast (38%) or in the Willamette Valley (36%). Nearly as many went to Mt. Hood/Columbia River Gorge (30%). A few toured other parts of the state, specifically, Central Oregon (20%), Southern Oregon (19%), or Eastern Oregon (14%). On average, visitors to Portland spent $274 per person per day in-destination in Oregon. Restaurants/dining accounted for the largest share of wallet ($70 per person per day), followed closely by lodging ($69). Remaining expenditures for recreation, rental cars, gas, groceries, and ground transportation hovered between $19 and $32 each per day. Two-thirds of 2021-2022 Portland visitors enjoyed food and drink while on their trip (67%), the leading activity. Almost half (44%) engaged in outdoor recreation (hiking/biking/fishing, etc.). A quarter to a third of visitors also chose these popular activities: shopping (31%), scenic rides (26%), business/family events (26%), and/or arts/cultural (24%) activities. SATISFACTION, RECOMMEND, & RETURN Visitors to Portland consistently expressed very strong satisfaction in all three measures: satisfaction, recommending, and intent to return. Nearly all visitors in 2021-2022 were "very satisfied" or "satisfied" overall with their Oregon trip that included Portland (94%). Plus, at least four-in-five assigned top marks to local food (90%), inclusiveness/welcoming (84%), outdoor recreation (83%), and value for money (79%). Safety placed slightly lower (72%). An excellent level of nine-in-ten Portland visitors feel "likely" or "extremely likely" to return to Oregon in the next 12 months (87%).
PORTLAND REGION VISITORS Who They Are Gender Ethnicity Female: 58.4% 80.3% White/Caucasian: Male: 40.3% 7.5% Asian: Other: 4.1% 6.3% Hispanic/Latino: 2.9% Average Age: 48.7 Black/African American: 3.1% Gen Z: 8.4% Native American/Indigenous: Millennials: 28.6% Gen Xers: 28.1% Boomers or older: 34.8% Children in Household 27.1% Under 18: Household Income $119,757 Accessibility Marital Status Has Accessibility Needs: 15.7% 70.9% Married/partnered: 19.6% Single:
PORTLAND REGION VISITORS Trip Details TRAVELER TYPE AVERAGE LENGTH OF STAY PRIMARY PURPOSE Vacation/leisure Visit friends/family 46.7% 25.2% 13.6% 4.0% 3.2% 1.8% 5.9 Business First Time 16.8% Repeat 83.2% Special event/festival Bleisure DAYS Conference/convention REGION VISITED AVERAGE DAILY SPEND PER PERSON AVERAGE PARTY SIZE $274 Portland Region 100.0% Lodging Restaurants/ dining Retail Recreation/entertainment Rental car Gasoline Grocery Ground transportation 2.6 Oregon Coast 37.9% $69 2.2 Willamette Valley 35.9% $70 Central Oregon 20.3% 0.4 $32 Southern Oregon 18.8% $30 $29 Adults Children Total Mt. Hood/Columbia River Gorge 30.1% $19 $19 Eastern Oregon 13.6% Portland Region
PORTLAND REGION VISITORS Destination Perceptions ACTIVITIES LIKELIHOOD TO RECOMMEND KEY SATISFACTION RATINGS Food and drink 67.0% Overall Trip: 94.0% satisfied 39 Outdoor recreation 43.6% Shopping 31.2% Local Food: 90.2% satisfied NET PROMOTER SCORE Scenic ride 26.2% Business or family related events Outdoor Recreation: 83.1% satisfied 25.9% Arts and cultural heritage LIKELIHOOD TO RETURN NEXT 12 MONTHS 23.6% Inclusive/Welcoming: 84.0% satisfied Attractions and entertainment 13.6% Festival or special event 9.8% Value for Money: 79.4% satisfied No Health and wellness services 7.7% 13.4% Yes 86.6% Sporting events 7.0% Safe: 71.9% satisfied Agricultural experience 5.1%
FIRST TIME VS REPEAT VISITOR Figure 1: First Time vs Repeat Visitation 12.3% 12.6% 13.4% 13.6% 13.9% 14.0% 16.8% 17.2% First Time Repeat 87.7% 87.4% 86.6% 86.4% 86.1% 86.0% 83.2% 82.8% Total Portland Region Oregon Coast Willamette Valley Central Oregon Southern Oregon Mt. Hood/ Columbia River Gorge Eastern Oregon AVERAGE LIFETIME VISITS 6.6 6.8 7.7 7.7 7.7 7.1 7.3 6.9 Question: In total, how many trips have you taken to or within Oregon? If this was your first trip to/within Oregon please select 1.
REGIONS VISITED Figure 2: Statewide Regions Visited Detail by Region Mt. Hood/ Columbia River Gorge Portland Region Oregon Coast Willamette Valley Central Oregon Southern Oregon Eastern Oregon Portland Region 46.3% Total Oregon Coast 36.8% Portland Region 46.3% 100.0% 47.7% 48.2% 43.4% 41.2% 70.4% 46.7% Oregon Coast 36.8% 37.9% 100.0% 45.8% 45.8% 40.9% 59.9% 42.0% Willamette Valley 34.5% Willamette Valley 34.5% 35.9% 43.0% 100.0% 39.1% 37.1% 48.3% 37.1% Central Oregon 21.7% Central Oregon 21.7% 20.3% 27.0% 24.6% 100.0% 34.3% 39.5% 44.4% Southern Oregon 21.1% Southern Oregon 21.1% 18.8% 23.4% 22.7% 33.4% 100.0% 31.2% 37.8% Mt. Hood/Columbia River Gorge Mt. Hood/Columbia River Gorge 19.8% 30.1% 32.2% 27.7% 36.1% 29.3% 100.0% 41.6% 19.8% Eastern Oregon 13.5% 13.6% 15.4% 14.5% 27.6% 24.1% 28.3% 100.0% Eastern Oregon 13.5% Base 17761 9155 6975 4884 3769 2616 4020 2196 Question: Which region(s) in Oregon did you visit on this trip? (Select all that apply)
PRIMARY REGION VISITED Figure 3: Statewide Primary Region Visited Detail by Region Mt. Hood/ Columbia River Gorge Portland Region 26.3% Portland Region Oregon Coast Willamette Valley Central Oregon Southern Oregon Eastern Oregon Total Willamette Valley 20.6% Portland Region 26.3% 56.7% 13.6% 12.4% 10.7% 8.5% 25.0% 12.6% Oregon Coast 20.2% Willamette Valley 20.6% 14.1% 15.9% 59.1% 10.6% 9.1% 14.7% 8.6% Central Oregon 10.3% 4.6% 5.5% 4.5% 46.9% 6.2% 8.0% 8.4% Southern Oregon 12.4% Eastern Oregon 6.2% 2.7% 2.5% 2.1% 6.4% 5.2% 5.4% 44.0% Central Oregon 10.3% Mt. Hood/Columbia River Gorge 4.0% 3.1% 2.2% 1.7% 2.5% 2.1% 19.9% 4.6% Oregon Coast 20.2% 13.3% 54.5% 13.9% 13.5% 12.1% 19.2% 12.3% Eastern Oregon 6.2% Southern Oregon 12.4% 5.4% 5.8% 6.4% 9.5% 56.7% 7.8% 9.5% Mt. Hood/Columbia River Gorge 4.0% Base 17762 9155 6975 4884 3769 2616 4020 2196 Question: Which region was your primary destination (e.g. the main attraction) for this trip?
PORTLAND REGION CITIES VISITED Figure 4: Portland Region Cities Visited Detail by Region Mt. Hood/ Columbia River Gorge 75.6% 32.0% 23.9% 23.1% 24.1% 15.6% 14.3% 10.7% 8.7% 6.6% 7.1% 4.5% 5.9% 4.0% 3.1% 5.3% 4.3% 3.7% 3.8% 3.5% 2.9% 2.8% 397 Portland Region Oregon Coast Willamette Valley Central Oregon Southern Oregon Eastern Oregon Portland Beaverton Lake Oswego Oregon City Hillsboro 77.7% Total 23.6% 16.6% 16.9% 15.9% 13.0% 11.2% 7.3% 6.2% 4.7% 4.6% 3.0% 2.9% 2.1% 2.3% 2.2% 2.8% 2.4% 2.0% 2.0% 1.7% 1.3% Portland Beaverton Lake Oswego Oregon City Hillsboro Tigard Tualatin Forest Grove West Linn Sherwood Saint Helens King City Rainier Vernonia Warren Scappoose Westport Columbia City Birkenfeld Prescott Deer Island Clatskanie Base 77.7% 23.6% 16.6% 16.9% 15.9% 13.0% 11.2% 7.3% 6.2% 4.7% 4.6% 3.0% 2.9% 2.1% 2.3% 2.2% 2.8% 2.4% 2.0% 2.0% 1.7% 1.3% 1553 78.0% 23.6% 16.7% 16.8% 15.9% 12.9% 11.3% 7.3% 6.1% 4.7% 4.6% 2.8% 2.9% 2.0% 2.2% 2.1% 2.7% 2.4% 1.9% 1.9% 1.7% 1.3% 1522 83.3% 36.5% 26.3% 24.5% 23.5% 17.1% 16.7% 9.5% 8.3% 5.3% 6.7% 3.1% 3.8% 1.9% 1.4% 1.7% 3.2% 2.2% 1.1% 2.3% 1.4% 0.6% 376 81.6% 32.7% 31.8% 24.4% 23.6% 20.6% 18.1% 10.5% 9.3% 6.6% 7.1% 3.5% 3.2% 1.5% 2.0% 1.4% 3.2% 1.5% 1.3% 2.5% 1.5% 0.7% 356 81.7% 35.2% 34.2% 30.7% 24.3% 20.8% 15.3% 10.6% 9.7% 5.1% 7.2% 6.3% 3.2% 3.2% 3.3% 3.4% 3.9% 5.1% 3.6% 3.2% 2.3% 1.4% 227 74.9% 34.3% 29.0% 30.7% 23.0% 17.9% 19.2% 10.2% 12.0% 9.0% 7.7% 7.4% 3.9% 5.7% 5.4% 2.9% 5.2% 6.2% 5.8% 5.2% 3.9% 3.0% 219 70.8% 27.4% 29.0% 37.6% 24.4% 15.4% 18.0% 14.7% 16.1% 9.0% 10.1% 7.5% 8.0% 8.0% 8.4% 10.0% 8.3% 6.8% 7.5% 6.2% 6.0% 6.4% 230 Tigard Tualatin Forest Grove West Linn Sherwood Saint Helens King City Rainier Vernonia Warren Scappoose Westport Columbia City Birkenfeld Prescott Deer Island Clatskanie Question: Which cities in the Portland region did you visit on the most recent trip? (Select all that apply)
PRIMARY PURPOSE OF TRIP Figure 5: Statewide Primary Purpose of Trip Detail by Region Mt. Hood/ Columbia River Gorge Portland Region Oregon Coast Willamette Valley Central Oregon Southern Oregon Eastern Oregon Vacation/leisure Total 51.7% Visit friends/family 23.0% Vacation/leisure 51.7% 46.7% 64.0% 49.6% 59.3% 53.5% 58.5% 58.8% Visit friends/family 23.0% 25.2% 19.9% 25.5% 18.7% 22.6% 20.6% 15.8% Business 11.4% Business 11.4% 13.6% 5.2% 9.5% 8.7% 10.0% 7.6% 11.7% Attend a special event/festival 3.9% Attend a special event/festival 3.9% 4.0% 2.6% 4.8% 3.2% 3.1% 4.0% 2.8% Combination of business and leisure 3.4% Combination of business and leisure 3.4% 3.2% 3.4% 3.9% 4.1% 4.1% 3.9% 4.5% Attend a conference/convention 1.6% 1.8% 0.8% 1.2% 1.4% 2.0% 1.2% 2.2% Attend a conference/convention 1.6% Other personal reasons 4.8% 5.4% 4.0% 5.4% 4.5% 4.8% 4.2% 4.2% Other personal reasons 4.8% Base 17761 9155 6975 4884 3769 2616 4020 2196 Question: What was the primary purpose of your trip?
LENGTH OF STAY DAYS Figure 6: Average Length of Stay - Days 4.8% 6.0% 7.8% 8.0% 8.6% 9.5% 9.8% 31.3% 29.7% 32.0% 31.1% 31.9% 36.6% 36.5% 35.5% 1 day 2-3 days 3-4 days 5+ days 33.2% 37.2% 34.2% 33.3% 34.3% 35.2% 36.0% 36.6% 31.1% 27.3% 27.0% 26.7% 24.0% 20.3% 19.6% 18.4% Total Portland Region Oregon Coast Willamette Valley Central Oregon Southern Oregon Mt. Hood/ Columbia River Gorge Eastern Oregon 5.4 5.9 6.3 6.1 6.4 5.5 6.2 5.7 MEAN Question: How many days and nights did you spend in Oregon during this trip? Days
LENGTH OF STAY NIGHTS Figure 7: Average Length of Stay Nights 4.9% 6.0% 6.3% 6.5% 6.6% 7.7% 7.1% 8.6% 10.4% 9.7% 10.6% 10.1% 11.2% 33.3% 36.9% 34.9% 33.1% 35.0% 38.4% 37.5% 37.7% 0 day trip only 1 night 2-3 nights 3-4 nights 5+ nights 28.5% 29.6% 28.7% 28.2% 29.8% 27.9% 30.1% 29.9% 26.2% 23.2% 23.0% 22.0% 18.5% 18.3% 16.7% 14.7% Total Portland Region Oregon Coast Willamette Valley Central Oregon Southern Oregon Mt. Hood/Columbia Eastern Oregon River Gorge 4.7 5.2 5.7 5.5 5.8 4.9 5.7 5.1 MEAN Question: How many days and nights did you spend in Oregon during this trip? Nights
LODGING TYPE Figure 8: Statewide Lodging Type Detail by Region Mt. Hood/ Columbia River Gorge Hotel 34.3% Portland Region Oregon Coast Willamette Valley Central Oregon Southern Oregon Eastern Oregon Total Vacation rental 16.8% Hotel 34.3% 37.6% 35.7% 37.5% 34.4% 38.3% 38.9% 35.7% Motel 14.7% Private home of friends or family 11.5% 11.9% 13.2% 15.1% 17.9% 16.3% 15.3% 16.4% Motel Vacation rental (e.g. Airbnb, Vacasa, Vrbo) Private home 14.7% 12.6% 17.8% 12.2% 18.2% 23.2% 17.3% 25.9% Private home 14.3% 16.8% 15.5% 24.7% 18.8% 23.5% 16.3% 22.3% 16.6% Private home of friends or family 11.5% 14.3% 19.4% 10.5% 15.1% 6.7% 6.7% 11.7% 4.4% Campground 8.7% Campground (camping/RV) 8.7% 6.3% 11.3% 8.8% 13.7% 15.1% 11.8% 19.7% Bed & breakfast 8.6% Bed & breakfast Glamping site (an upscale style of camping with amenities) My second/vacation home 8.6% 9.4% 6.9% 7.1% 8.9% 12.3% 9.6% 16.9% 3.3% 2.9% 2.7% 2.6% 5.2% 6.9% 4.4% 8.7% Camp site 3.3% 2.3% 1.6% 3.0% 2.4% 4.2% 2.2% 2.7% 2.2% Glamping site 3.3% Camp site (e.g. backcountry) 3.3% 2.9% 3.2% 3.0% 5.8% 6.1% 5.2% 10.2% My second/vacation home 2.3% Working farm, ranch or vineyard 0.6% 0.7% 0.7% 1.1% 0.9% 1.0% 0.8% 1.6% Base 17231 8961 6713 4716 3695 2535 3908 2137 Working farm, ranch or vineyard 0.6% Question: In which type of lodging/accommodations did you stay in during this trip? (Select all that apply)
ARRIVAL TRANSPORTATION Figure 11: Statewide Arrival Transportation Detail by Region Mt. Hood/ Columbia River Gorge Own car 65.9% Portland Region Oregon Coast Willamette Valley Central Oregon Southern Oregon Eastern Oregon Total Airplane 19.5% Own car 65.9% 63.0% 70.2% 67.4% 65.5% 64.1% 66.5% 59.9% Own camper/RV/van 5.8% Airplane 19.5% 23.2% 16.3% 21.5% 18.0% 16.1% 19.2% 18.3% Rental car 5.0% Own camper/RV/van 5.8% 4.3% 7.4% 5.5% 7.6% 7.8% 6.1% 9.4% Train 1.5% Rental car 5.0% 5.6% 4.1% 3.2% 4.8% 6.7% 3.9% 5.3% Train 1.5% 2.0% 0.6% 1.0% 1.4% 1.7% 1.9% 2.4% Rental camper/RV/van 0.7% Rental camper/RV/van 0.7% 0.7% 0.6% 0.6% 1.3% 1.5% 0.8% 1.9% Bicycle 0.3% Bicycle 0.3% 0.4% 0.0% 0.2% 0.3% 0.3% 0.1% 0.4% Motorcycle 0.5% Motorcycle 0.5% 0.2% 0.2% 0.2% 0.7% 0.5% 0.8% 1.2% Tour bus 0.3% 0.2% 0.1% 0.1% 0.3% 0.4% 0.3% 0.5% Tour bus 0.3% Highway bus (e.g. Greyhound, Bolt) 0.1% 0.1% 0.1% 0.0% 0.0% 0.2% 0.0% 0.1% Highway bus 0.1% Ride sharing platform(s) (e.g. Uber, Lyft) 0.3% 0.2% 0.2% 0.2% 0.1% 0.4% 0.3% 0.5% Ride sharing platform(s) 0.3% Boat or other water transportation 0.1% 0.1% 0.1% 0.1% 0.1% 0.1% 0.2% 0.2% Base 9305 3818 4654 3067 2723 2029 2471 1790 Boat or other water transportation 0.1% Question: How did you arrive for this trip and how did you depart? Arrival
DEPARTURE TRANSPORTATION Figure 12: Statewide Departure Transportation Detail by Region Mt. Hood/ Columbia River Gorge 66.4% Own car 65.8% Portland Region Oregon Coast Willamette Valley Central Oregon Southern Oregon Eastern Oregon Total Airplane 18.9% Own car 65.8% 63.2% 69.7% 67.2% 65.7% 63.8% 60.8% Own camper/RV/van 5.8% Airplane 18.9% 22.7% 16.7% 21.5% 17.1% 15.3% 19.3% 16.3% Rental car 5.0% Own camper/RV/van 5.8% 4.4% 7.6% 5.6% 7.8% 8.2% 6.0% 9.1% Train 1.4% Rental car 5.0% 5.0% 3.8% 3.1% 4.7% 6.7% 4.1% 6.0% Rental camper/RV/van 1.0% Train 1.4% 1.8% 0.5% 1.0% 1.6% 2.0% 1.3% 2.5% Rental camper/RV/van 1.0% 0.9% 0.7% 0.6% 1.3% 1.8% 0.6% 2.0% Tour bus 0.5% Tour bus 0.5% 0.4% 0.2% 0.2% 0.5% 0.4% 0.8% 0.7% Motorcycle 0.5% Motorcycle 0.5% 0.4% 0.3% 0.3% 0.8% 0.7% 0.7% 1.5% Bicycle 0.2% Bicycle 0.2% 0.3% 0.0% 0.1% 0.0% 0.3% 0.3% 0.0% Highway bus 0.3% Highway bus (e.g. Greyhound, Bolt) Ride sharing platform(s) (e.g. Uber, Lyft) Boat or other water transportation 0.3% 0.4% 0.1% 0.2% 0.2% 0.2% 0.2% 0.2% 0.4% 0.4% 0.1% 0.3% 0.3% 0.6% 0.4% 0.8% Ride sharing platform(s) 0.4% 0.1% 0.1% 0.1% 0.0% 0.1% 0.1% 0.0% 0.0% Boat or other water transportation 0.1% Base 9305 3818 4654 3067 2723 2029 2471 1790 Question: How did you arrive for this trip and how did you depart? Departure
IN-DESTINATION TRANSPORTATION Figure 13: Statewide In-Destination Transportation Detail by Region Mt. Hood/ Columbia River Gorge 62.4% Own car 60.9% Portland Region Oregon Coast Willamette Valley Central Oregon Southern Oregon Eastern Oregon Total Rental car 22.7% Own car 60.9% 53.0% 67.6% 64.1% 67.7% 67.4% 64.7% Walking 19.6% Walking 19.6% 21.7% 23.8% 22.1% 23.4% 18.3% 23.2% 19.0% Ride sharing platforms 6.6% Rental car 22.7% 27.2% 22.2% 24.4% 19.3% 19.9% 24.2% 20.2% Train 4.1% Ride sharing platforms 6.6% 10.7% 4.5% 5.6% 5.2% 4.6% 6.6% 5.2% Bicycle 3.7% Own camper/RV/van 3.7% 2.7% 5.1% 3.4% 5.8% 6.3% 4.9% 8.7% Light rail 3.6% 5.9% 3.2% 3.3% 3.3% 2.5% 6.0% 3.1% Own camper/RV/van 3.7% Bicycle 3.7% 4.0% 3.8% 3.6% 6.8% 4.5% 5.5% 6.3% Light rail 3.6% Train 4.1% 6.1% 2.4% 2.7% 3.9% 3.9% 4.5% 6.9% Tour bus 2.0% Tour bus 2.0% 1.9% 1.4% 1.6% 2.7% 3.7% 3.0% 4.4% Rental camper/RV/van 1.9% Rental camper/RV/van 1.9% 2.1% 1.3% 1.5% 2.5% 3.3% 2.9% 5.5% Boat or other water transportation 1.7% 1.8% 2.2% 1.6% 2.9% 2.7% 3.1% 3.8% Boat or other water transportation 1.7% Highway bus 1.5% 1.5% 0.9% 1.4% 2.3% 2.4% 1.8% 3.6% Highway bus 1.5% Motorcycle 1.2% 1.2% 0.9% 0.8% 2.2% 2.1% 1.7% 4.0% Motorcycle 1.2% Electric scooter Wheelchair/personal mobility scooter/vehicle Base 0.5% 0.8% 0.4% 0.4% 0.4% 0.3% 0.7% 0.6% Electric scooter 0.5% 0.3% 0.3% 0.5% 0.4% 0.5% 0.3% 0.6% 0.8% Wheelchair/scooter 0.3% 17761 9155 6975 4884 3769 2616 4020 2196 Question: Which modes of transportation did you use in the destination(s) you visited? (Select all that apply)
VEHICLE TYPE Figure 14: Statewide Vehicle Type Detail by Region Mt. Portland Region Oregon Coast Willamette Valley Central Oregon Southern Oregon Hood/Colum bia River Gorge Eastern Oregon Total Gas or diesel vehicle 87.3% Gas or diesel vehicle 87.3% 86.6% 89.2% 86.5% 86.4% 87.0% 88.7% 87.0% Hybrid vehicle 9.9% Hybrid vehicle 9.9% 10.2% 9.2% 11.3% 11.1% 9.9% 9.1% 9.0% Electric vehicle 2.7% 3.0% 1.6% 2.2% 2.4% 3.1% 2.0% 3.9% Electric vehicle 2.7% Alternative fuel vehicle 0.1% 0.2% 0.1% 0.0% 0.1% 0.0% 0.1% 0.1% Alternative fuel vehicle 0.1% Base 6257 2288 3438 1975 1887 1371 1602 1149 Question: What type of vehicle did you use?
PARTY COMPOSITION Figure 15: Statewide Travel Party Composition Detail by Region Mt. Portland Region Oregon Coast Willamette Valley Central Oregon Southern Oregon Hood/Colum bia River Gorge Eastern Oregon Spouse/partner 77.1% Total Children under 18 19.9% Spouse/partner 77.1% 75.9% 77.3% 77.3% 78.3% 79.9% 77.5% 77.9% Friend(s) 15.6% Children under 18 19.9% 20.9% 15.0% 13.3% 22.2% 24.2% 20.3% 27.3% Friend(s) 15.6% 16.8% 16.2% 17.0% 16.3% 12.4% 16.7% 16.1% Adult children 11.0% Adult children 11.0% 12.4% 12.1% 11.9% 11.6% 10.2% 11.4% 9.7% Pet(s) 2.8% Pet(s) 2.8% 2.0% 3.4% 2.5% 4.0% 3.4% 3.0% 3.0% Parents 3.9% Parents 3.9% 4.2% 3.8% 3.6% 3.3% 4.4% 3.9% 3.7% Coworkers 0.9% 1.0% 0.6% 0.7% 1.2% 1.4% 1.0% 1.1% Coworkers 0.9% Other relatives 7.2% 7.2% 8.5% 7.0% 6.6% 7.8% 8.5% 7.4% Other relatives 7.2% Base 8073 3246 4200 2701 2409 1759 2188 1533 Question: Who were you traveling with? (Select all that apply)
TRAVEL PARTY SIZE ADULTS Figure 16: Average Party Size Adults 11.8% 13.2% 13.5% 13.8% 15.3% 15.5% 16.2% 16.4% 1 adult 2 adults 3+ adults 67.0% 66.4% 66.0% 67.4% 65.2% 63.8% 67.3% 66.8% 21.2% 20.3% 20.2% 20.0% 19.5% 18.9% 17.2% 16.8% Total Portland Region Oregon Coast Willamette Valley Central Oregon Southern Oregon Mt. Hood/ Columbia River Gorge Eastern Oregon 2.2 2.2 2.3 2.3 2.2 2.2 2.3 2.2 MEAN Question: How many people (including yourself) were in your immediate travel party? Adults (18 years and older)
CHILDREN IN TRAVEL PARTY Figure 17: Children in Travel Party 72.0% 76.0% 77.1% 79.0% 79.2% 79.6% No children 1 child 2+ children 84.1% 86.3% 13.3% 9.5% 11.7% 10.6% 9.5% 10.3% 7.5% 6.5% 14.7% 13.4% 12.2% 10.9% 10.5% 10.4% 8.5% 7.3% Total Portland Region Oregon Coast Willamette Valley Central Oregon Southern Oregon Mt. Hood/ Columbia River Gorge Eastern Oregon 0.4 0.4 0.3 0.2 0.4 0.4 0.4 0.5 MEAN Question: How many people (including yourself) were in your immediate travel party? Children (17 years and under)
PER PARTY PER DAY SPEND Figure 18: Per Party Per Day Spend $593 $544 $540 Lodging $520 $498 $480 $130 $466 $466 Restaurants/ dining $132 $127 $130 $132 Retail $125 $110 $117 $118 $111 $114 Recreation/entertainment $121 $70 $117 $117 $110 $119 Rental car $62 $62 $77 $58 $58 $53 $58 $66 $54 $67 Gasoline $43 $65 $56 $52 $55 $41 $51 $38 $74 $46 Grocery $41 $43 $43 $63 $49 $61 $50 $47 $41 $41 $33 $64 Ground transportation $49 $53 $39 $37 $40 $32 $35 $26 $20 $16 $11 Total $11 $10 $7 $7 Portland Region Oregon Coast Willamette Valley Central Oregon Southern Oregon Mt. Hood/ Columbia River Gorge Eastern Oregon Question: Excluding airfare, please tell us approximately how much you spent PER DAY in Oregon on each of the following categories.
PER PERSON PER DAY SPEND Figure 19: Per Person Per Day Spend $274 $270 $260 $259 $259 $257 $253 $249 Lodging $59 $69 Restaurants/ dining $65 $63 $60 $66 $66 $66 Retail $50 $70 $53 $54 $61 $61 Recreation/entertainment $62 $59 $32 $30 $30 Rental car $29 $32 $29 $35 $31 $29 $31 $32 Gasoline $33 $30 $29 $20 $28 $29 $20 $18 $23 $24 $29 $34 $21 Grocery $23 $30 $29 $23 $25 $24 $19 $22 $29 $23 Ground transportation $25 $21 $19 $20 $20 $18 $12 $10 $8 $6 Total $6 $6 $4 $4 Portland Region Oregon Coast Willamette Valley Central Oregon Southern Oregon Mt. Hood/ Columbia River Gorge Eastern Oregon Question: Excluding airfare, please tell us approximately how much you spent PER DAY in Oregon on each of the following categories.
PER PARTY PER TRIP SPEND Figure 20: Per Party Per Trip Spend $3,482 $3,380 $3,224 $3,137 Lodging $2,970 $2,928 $2,749 $845 $741 Restaurants/ dining $2,516 $806 $832 $699 $763 Retail $690 $627 $730 $637 $750 Recreation/entertainment $611 $737 $399 $714 $397 $702 $594 Rental car $360 $341 $439 $365 $429 $354 $319 $286 $363 Gasoline $403 $245 $353 $243 $336 $301 $281 $226 $285 $422 $258 Grocery $262 $390 $232 $289 $347 $310 $296 $250 $221 $195 $365 $339 Ground transportation $270 $242 $252 $200 $189 $214 $148 $110 $102 $68 $59 Total $59 $44 $43 Portland Region Oregon Coast Willamette Valley Central Oregon Southern Oregon Mt. Hood/ Columbia River Gorge Eastern Oregon Question: Excluding airfare, please tell us approximately how much you spent PER DAY in Oregon on each of the following categories.
PER PERSON PER TRIP SPEND Figure 21: Per Person Per Trip Spend $1,658 $1,617 $1,612 $1,569 $1,541 $1,536 Lodging $1,414 $1,398 $402 $406 $403 $337 $416 Restaurants/ dining $401 $333 $354 Retail $347 $285 $375 $413 $369 $376 Recreation/entertainment $291 $330 $181 $189 $180 Rental car $162 $187 $183 $186 $200 $159 $204 $202 $173 Gasoline $177 $176 $177 $111 $156 $116 $107 $143 $129 $170 $138 $129 $192 Grocery $186 $165 $155 $148 $123 $115 $132 $166 $162 Ground transportation $128 $121 $111 $111 $126 $112 $67 $52 $49 $35 $34 $33 Total $22 $22 Portland Region Oregon Coast Willamette Valley Central Oregon Southern Oregon Mt. Hood/ Columbia River Gorge Eastern Oregon Question: Excluding airfare, please tell us approximately how much you spent PER DAY in Oregon on each of the following categories.
ACTIVITIES & EXPERIENCES Figure 22: Statewide In-Destination Activities & Experiences Eat and drink 64.9% Outdoor recreation 47.9% Shopping 31.0% Scenic ride 28.3% Business or family related events 22.2% Arts and cultural heritage 21.5% Attractions and entertainment 13.9% Attend a festival or special event 9.6% Health and wellness services 6.8% Sporting events 6.5% Participated in agricultural experience 4.7% Question: Which type of activities/experiences did you participate in during this trip? (Select all that apply)
ACTIVITIES & EXPERIENCES continued Mt. Total Portland Region Oregon Coast Willamette Valley Central Oregon Southern Oregon Hood/Columbia River Gorge Eastern Oregon Eat and drink (e.g. ate at local restaurants, wine tasting in downtown) Outdoor recreation (e.g. hiking, bicycling, fishing, playing golf, surfing) Shopping (e.g. tax free retail shopping, recreational marijuana/dispensaries) Scenic ride (e.g. driving or motorcycling for pleasure, scenic & historic train rides such as Oregon Coast Scenic Railroad or Eagle Cap Excursion Train) Business or family related events (e.g. work meeting, conference, wedding, bachelor/bachelorette party, family reunion) Arts and cultural heritage (e.g. attending a live music concert, visiting a museum, a downtown or historic district or sites related to Native American culture) 64.9% 67.0% 74.7% 70.1% 68.2% 65.5% 71.4% 60.9% 47.9% 43.6% 60.9% 46.2% 60.8% 52.2% 58.3% 52.5% 31.0% 31.2% 39.2% 31.9% 38.4% 34.8% 35.0% 36.1% 28.3% 26.2% 42.2% 32.5% 36.0% 37.4% 40.8% 38.1% 22.2% 25.9% 17.2% 24.5% 20.0% 24.4% 20.8% 22.3% 21.5% 23.6% 26.1% 22.4% 24.8% 25.2% 26.7% 29.8% Attractions and entertainment (e.g. amusement/theme/water park, casino/gambling/night club) 13.9% 13.6% 17.5% 13.2% 18.3% 19.7% 18.2% 22.5% 9.6% 9.8% 10.5% 12.1% 12.2% 13.5% 12.0% 13.9% Attend a festival or special event Health and wellness services (e.g. spa, massage, wellness center, yoga retreat) Sporting events (e.g. basketball/soccer/football/hokey games, running events) Participated in agricultural experience on a working landscape (e.g. took a guided farm/agricultural tour, horseback riding on a ranch) Base 6.8% 7.7% 5.9% 6.3% 9.8% 9.6% 8.8% 12.1% 6.5% 7.0% 5.7% 7.4% 8.6% 8.5% 7.9% 12.0% 4.7% 5.1% 3.9% 5.5% 6.0% 6.9% 6.8% 9.7% 17743 9150 6965 4879 3767 2613 4018 2195 Question: Which type of activities/experiences did you participate in during this trip? (Select all that apply)
OUTDOOR RECREATION ACTIVITIES Figure 23: Statewide Outdoor Recreation Activities Hiking 19.0% Visited national forest, refuge, scenic areas, monuments, BLM area 14.6% 13.7% 13.2% 11.6% Visited state parks Nature observation (wildlife/apiary/wildflower/bird watching/fall foliage) Beach-going Bicycling Swimming Fishing 4.8% 4.0% 3.5% 3.2% 3.1% 2.9% 2.8% 2.3% 2.2% 1.9% 1.3% 1.2% 1.2% 1.1% 1.1% 1.1% Visited Crater Lake National Park Rockhounding/collecting rock Dark sky/star viewing (at an observatory or individually) Golf Running Kayaking Visited a hot spring Foraging (collecting plants, mushrooms, berries) Oyster harvesting/crabbing/clamming Sailing/boating Whitewater rafting Stand-up paddle boarding Horseback riding Question: Which of the following outdoor recreation activities did you do on this trip? (Select all that apply)
OUTDOOR RECREATION continued Mt. Hood/ Columbia River Gorge 27.3% Total Portland Region Oregon Coast Willamette Valley Central Oregon Southern Oregon Eastern Oregon Hiking Visited national forest, refuge, scenic areas, monuments, and/or Bureau of Land Management areas Visited state parks Nature observation (wildlife/apiary/wildflower/bird watching/fall foliage) Beach-going Bicycling Swimming Fishing Visited Crater Lake National Park Rockhounding/collecting rock Dark sky/star viewing (at an observatory or individually) Golf Running Kayaking Visited a hot spring Foraging (collecting plants, mushrooms, berries) Oyster harvesting/crabbing/clamming Sailing/boating Whitewater rafting Stand-up paddle boarding Horseback riding Snow activities (snowmobiling, cross-country skiing, snowshoeing, downhill skiing, snowboarding) Rock climbing/mountaineering Sand dune boarding/buggy Hunting 19.0% 15.5% 29.6% 23.1% 32.5% 27.5% 27.2% 14.6% 12.0% 23.4% 17.1% 25.0% 22.8% 22.3% 22.8% 13.7% 11.5% 24.9% 17.1% 22.4% 19.8% 21.1% 21.1% 13.2% 10.2% 21.8% 15.3% 20.2% 19.8% 19.2% 22.3% 11.6% 4.8% 4.0% 3.5% 3.2% 3.1% 2.9% 2.8% 2.3% 2.2% 1.9% 1.3% 1.2% 1.2% 1.1% 1.1% 1.1% 9.9% 3.9% 3.4% 2.7% 2.4% 2.3% 2.1% 2.2% 2.2% 1.6% 2.0% 1.4% 1.1% 0.9% 0.9% 0.9% 1.0% 28.4% 6.2% 5.4% 5.2% 4.5% 5.9% 4.4% 3.7% 2.9% 3.3% 2.3% 2.2% 2.6% 1.7% 1.4% 1.4% 1.6% 14.0% 5.2% 4.3% 3.8% 3.5% 3.6% 3.5% 3.0% 2.4% 2.7% 2.4% 1.9% 1.2% 0.9% 1.2% 1.0% 1.1% 15.1% 11.2% 8.4% 6.9% 7.4% 4.9% 5.7% 6.3% 5.1% 4.9% 4.4% 2.6% 1.9% 1.9% 2.3% 3.0% 2.1% 14.6% 7.3% 7.6% 7.0% 10.2% 5.5% 5.2% 4.0% 3.9% 3.9% 3.9% 2.6% 2.1% 2.4% 3.0% 1.9% 2.2% 17.0% 6.9% 5.8% 4.7% 5.4% 3.9% 4.7% 3.8% 4.1% 3.2% 4.1% 3.0% 2.3% 1.7% 1.6% 1.7% 1.8% 15.1% 8.2% 8.7% 7.6% 6.8% 6.4% 7.2% 5.0% 4.9% 4.9% 7.3% 3.2% 2.5% 2.9% 3.3% 2.2% 2.8% 1.0% 0.7% 0.7% 0.9% 3.0% 1.6% 1.5% 2.1% 1.0% 0.8% 0.8% 0.7% 0.5% 16571 1.0% 0.8% 0.6% 0.8% 0.5% 8686 1.0% 1.5% 0.6% 1.1% 0.4% 6301 1.1% 0.9% 0.6% 0.6% 0.4% 4381 1.8% 1.7% 1.4% 1.5% 0.7% 3480 2.2% 1.9% 2.0% 1.6% 1.1% 2392 1.6% 1.5% 1.0% 1.4% 0.5% 3752 2.9% 2.2% 3.1% 2.9% 1.6% 2029 Question: Surfing, windsurfing and/or kiteboarding Scuba diving Base
ARTS & CULTURE ACTIVITIES Figure 24: Statewide Arts & Culture Activities Detail by Region Downtown district, historic old town, etc. 9.9% Mt. Hood/ Columbia River Gorge Portland Region Oregon Coast Willamette Valley Central Oregon Southern Oregon Eastern Oregon Total Art galleries/cultural centers/museums 7.7% Downtown district, historic old town, etc. 9.9% 9.2% 16.6% 12.6% 16.5% 15.2% 15.0% 18.0% Historic sites/history-themed parks 6.2% Art galleries/cultural centers/museums 7.7% 8.2% 12.3% 9.6% 12.2% 11.5% 11.8% 14.8% Live music 4.0% Historic sites/history-themed parks 6.2% 5.4% 10.3% 7.2% 10.1% 10.1% 10.1% 13.9% Live music 4.0% 4.3% 5.4% 4.7% 7.2% 7.9% 6.1% 9.4% Photography/painting/drawing 3.6% Photography/painting/drawing 3.6% 3.7% 5.3% 3.7% 6.4% 6.3% 5.8% 8.5% Native American cultural sites 3.3% Native American cultural sites 3.3% 2.9% 5.0% 3.3% 6.9% 7.0% 5.9% 10.4% Cultural/historical festival 2.9% 3.2% 3.9% 3.3% 5.5% 6.2% 4.2% 8.1% Cultural/historical festival 2.9% Theater or performing arts 2.5% 2.5% 2.7% 2.8% 4.2% 5.3% 3.4% 6.0% Theater or performing arts 2.5% Ghost town 1.4% 1.4% 1.5% 1.2% 3.4% 3.1% 2.5% 5.7% Rodeo 0.8% 0.8% 0.9% 0.6% 2.1% 1.9% 1.2% 3.5% Ghost town 1.4% Base 15444 8386 5522 4057 3051 2169 3485 1907 Rodeo 0.8% Question: Which of the following arts and cultural heritage related activities did you do on this trip? (Select all that apply)
FOOD & DINING ACTIVITIES Figure 25: Statewide Food & Dining Activities Detail by Region Mt. Hood/ Columbia River Gorge Portland Region Oregon Coast Willamette Valley Central Oregon Southern Oregon Eastern Oregon Total Local restaurants/bars 35.3% Coffee roasters/tea makers 14.4% Local restaurants/bars 35.3% 31.7% 50.4% 43.8% 47.8% 45.4% 44.9% 43.6% Coffee roasters/tea makers 14.4% 13.7% 20.2% 17.0% 22.7% 19.5% 19.4% 20.3% Winery/wine tasting room 14.3% Winery/wine tasting room 14.3% 14.5% 19.6% 26.3% 17.6% 19.9% 20.6% 17.3% Brewery 14.1% Brewery 14.1% 12.8% 21.2% 17.1% 25.7% 19.3% 22.5% 20.0% Visited artisan producer (chocolate, bakery, etc.) Visited artisan producer (chocolate, bakery, etc.) 9.5% 9.5% 9.0% 14.5% 12.3% 13.2% 12.2% 12.9% 14.4% Food cart(s) Food cart(s) 8.9% 9.3% 11.0% 11.0% 16.9% 13.5% 15.0% 15.9% 8.9% Distillery 3.5% 3.6% 5.3% 4.8% 6.5% 5.5% 5.6% 7.1% Distillery 3.5% Participated in a self-guided food or beverage trail Participated in a self-guided food or beverage trail 3.1% 3.4% 4.0% 3.7% 4.8% 5.5% 4.6% 7.1% 3.1% Cidery 2.1% 2.0% 2.7% 2.5% 4.0% 4.2% 3.9% 4.0% Cidery 2.1% Base 17234 8996 6683 4711 3590 2504 3904 2104 Question: Which of the following eat and drink activities did you do during this trip? (Select all that apply)
AGRICULTURE ACTIVITIES Figure 26: Statewide Agriculture Activities Detail by Region Guided farm/agricultural tour on a working landscape 1.9% Mt. Hood/ Columbia River Gorge Portland Region Oregon Coast Willamette Valley Central Oregon Southern Oregon Eastern Oregon Total Self-guided food, farm, or beverage trail 1.6% Guided farm/agricultural tour on a working landscape (farm, ranch, vineyard, etc.) 1.9% 2.0% 2.1% 2.5% 3.6% 3.1% 3.4% 5.8% Self-guided food, farm, or beverage trail 1.6% 1.7% 1.6% 2.1% 2.9% 4.0% 2.3% 5.0% Farmers market 1.6% Farmers market 1.6% 1.7% 1.4% 2.0% 2.6% 3.0% 2.6% 5.5% Visited artisan producer 1.6% Visited artisan producer (salt, wool, flowers, etc.) 1.6% 1.6% 1.7% 2.1% 3.1% 3.1% 2.4% 4.5% Farm stand at a farm 1.5% 1.5% 1.5% 1.7% 2.8% 3.0% 2.9% 3.8% Farm stand at a farm 1.5% Base 14646 8092 4949 3773 2783 2003 3266 1766 Question: Which of the following agricultural experiences did you do during this trip? (Select all that apply)
HEALTH & WELLNESS ACTIVITIES Figure 27: Statewide Health & Wellness Activities Detail by Region Massage 2.5% Mt. Hood/ Columbia River Gorge Portland Region Oregon Coast Willamette Valley Central Oregon Southern Oregon Eastern Oregon Total Spa 2.3% Massage 2.5% 2.3% 2.7% 2.6% 5.3% 5.0% 4.0% 7.0% Spa 2.3% 2.2% 2.1% 2.3% 4.8% 4.3% 3.3% 6.6% Cosmetic services (nail, hair, facials) 1.7% Cosmetic services (nail, hair, facials) 1.7% 1.8% 1.0% 1.3% 3.9% 4.0% 1.9% 5.5% Wellness center 1.6% Wellness center 1.6% 1.4% 1.3% 1.4% 3.8% 3.0% 1.9% 5.4% Medical treatment 1.4% 1.7% 1.0% 1.0% 3.3% 2.9% 1.4% 4.2% Medical treatment 1.4% Yoga retreat 1.0% 1.2% 0.7% 0.8% 2.1% 2.3% 1.5% 4.3% Base 14718 8130 5003 3780 2821 2019 3276 1775 Yoga retreat 1.0% Question: Which of the following health and wellness activities did you do during this trip? (Select all that apply)
ENTERTAINMENT ACTIVITIES Figure 28: Statewide Entertainment Activities Detail by Region Mt. Hood/ Columbia River Gorge Portland Region Oregon Coast Willamette Valley Central Oregon Southern Oregon Eastern Oregon Bars/pubs 5.6% Total Casino/gambling 3.9% Bars/pubs 5.6% 4.7% 8.4% 6.6% 9.7% 10.5% 8.6% 11.3% Aquarium or zoo 3.7% Casino/gambling 3.9% 2.9% 6.5% 3.9% 6.9% 8.2% 5.1% 8.9% Aquarium or zoo (including petting zoo) 3.7% 3.6% 5.9% 3.2% 5.9% 7.2% 5.4% 7.6% Amusement or theme park 3.1% Amusement or theme park 3.1% 2.9% 3.6% 2.5% 5.9% 6.3% 5.0% 8.7% Night club/dancing 2.5% Night club/dancing 2.5% 2.1% 2.2% 1.7% 4.4% 4.8% 3.2% 7.2% Water park 2.2% 1.9% 1.9% 1.3% 4.0% 4.4% 3.3% 6.6% Water park 2.2% Standup comedy 1.2% 1.1% 1.2% 1.0% 2.3% 3.1% 1.8% 3.9% Standup comedy 1.2% Base 14987 8210 5232 3883 2892 2104 3342 1830 Question: Which of the following attractions and entertainment experiences did you do during this trip? (Select all that apply)
GUIDED TOURS Figure 29: Took Guided Tour Detail by Region Mt. Hood/ Columbia River Gorge Portland Region Oregon Coast Willamette Valley Central Oregon Southern Oregon Eastern Oregon Total Yes 7.4% 6.5% 6.4% 6.1% 11.1% 12.8% 9.8% 18.0% No, 92.3% No 92.3% 93.3% 93.4% 93.8% 88.4% 86.8% 89.6% 81.5% I am not sure 0.3% 0.2% 0.2% 0.2% 0.5% 0.5% 0.5% 0.5% I am not sure, 0.3% Base 17762 9155 6975 4884 3769 2616 4020 2196 Yes, 7.4% Question: Did you participate in any guided tour?
GUIDED TOUR TYPE Figure 30: Guided Group Tour Type Detail by Region Mt. Hood/ Columbia River Gorge 42.9% 37.8% 29.0% Portland Region Oregon Coast Willamette Valley Central Oregon Southern Oregon Eastern Oregon Total Wine/winery 36.9% Culture & history 32.3% Wine/winery Food or agriculture Culture & history Motorized water recreation (e.g. jetboats, fishing, whale watching) Arts (e.g. open studio tours, guided art trail walks) Motorized outdoor recreation (e.g. assisted bike, trolley, ATV, or dune buggy tours) Brewery or distillery Nature and wildlife photography Non-motorized outdoor recreation (e.g. horseback riding, guided hiking, bicycling) Non-motorized water recreation (e.g. whitewater rafting, kayaking, stand-up paddle boarding, drift boating, sailing) Downtown walking tours Helicopter aerial tours Other Base 36.9% 31.6% 32.3% 42.6% 32.7% 34.0% 37.6% 20.4% 31.3% 55.0% 23.5% 24.6% 34.8% 32.7% 35.0% 37.2% 30.5% 33.2% 40.5% 44.0% 43.7% Food or agriculture 31.6% Motorized water recreation 26.7% 26.7% 26.8% 31.1% 21.3% 33.2% 35.3% 31.1% 29.2% Arts 25.1% 25.1% 27.3% 18.7% 19.2% 29.5% 28.7% 28.6% 35.7% Nature and wildlife photography 23.4% 20.7% 22.1% 15.0% 13.2% 26.8% 22.2% 30.8% 27.4% Motorized outdoor recreation 20.7% 17.9% 23.4% 23.0% 23.1% 16.5% 24.2% 15.6% 20.1% 20.8% 28.2% 25.1% 24.5% 21.1% 20.9% 24.3% 28.3% Brewery or distillery 17.9% Non-motorized water recreation 15.3% 12.5% 15.3% 10.8% 11.5% 19.2% 15.5% 14.8% 17.3% Downtown walking tours 12.8% Non-motorized outdoor recreation 12.5% 15.3% 14.6% 12.6% 11.2% 20.4% 22.4% 19.1% 18.4% Helicopter aerial tours 5.0% 12.8% 5.0% 6.3% 1490 12.4% 6.5% 6.1% 664 15.7% 4.0% 12.6% 437 13.3% 2.7% 11.4% 376 16.8% 7.8% 5.7% 469 14.4% 6.8% 9.2% 474 10.4% 4.8% 9.7% 423 12.9% 9.2% 4.6% 506 Other 6.3% Question: Which best describes the type of guided tour(s) you participated in? (Select all that apply)
SUSTAINABLE BEHAVIOR Figure 31: Sustainable Behavior Detail by Region Mt. Hood/ Columbia River Gorge Discarded all trash in appropriate receptacles 66.0% Portland Region Oregon Coast Willamette Valley Central Oregon Southern Oregon Eastern Oregon Total Carried reusable water bottle 52.2% Discarded all trash in appropriate receptacles Carried reusable water bottle 66.0% 62.9% 78.7% 75.0% 72.1% 69.4% 72.0% 63.4% Managed amount of waste I created 37.2% 52.2% 49.0% 62.2% 57.6% 59.0% 56.8% 59.2% 54.5% Visited businesses committed to sustainability 15.2% Managed amount of waste I created Visited businesses committed to sustainability Used public transit 37.2% 35.3% 46.1% 41.2% 42.5% 42.2% 43.0% 41.6% 15.2% 16.9% 15.9% 17.7% 16.6% 17.3% 18.2% 19.1% Used public transit 8.5% 8.5% 11.5% 7.5% 7.5% 8.6% 9.3% 10.5% 11.4% Use low-emissions vehicle 8.0% Use low-emissions vehicle Use low-emissions vehicle (e.g. EV or hybrid car) Purchased carbon offsets 8.0% 8.4% 8.5% 8.7% 7.3% 7.0% 8.1% 8.3% Use low-emissions vehicle (e.g. EV or hybrid car) 3.8% 3.8% 3.6% 3.7% 4.2% 5.8% 5.5% 4.6% 6.2% 3.1% 3.6% 1.7% 1.8% 3.6% 4.6% 3.2% 7.4% Purchased carbon offsets 3.1% Stayed at LEED-certified lodging 2.6% 2.9% 2.4% 2.4% 2.4% 3.1% 3.2% 4.6% Stayed at LEED-certified lodging 2.6% Stayed at LEED or green certified lodging 2.2% 1.9% 1.5% 2.2% 3.6% 3.8% 2.8% 5.0% Stayed at LEED or green certified lodging 2.2% Base 17613 9098 6881 4832 3722 2589 3979 2166 Question: Which of the following did you do for or during your Oregon trip? (Select all that apply)
DESTINATION RATING SCENIC BEAUTY Figure 32: Statewide Scenic Beauty Importance Detail by Region Mt. Hood/ Columbia River Gorge Portland Region Oregon Coast Willamette Valley Central Oregon Southern Oregon Eastern Oregon Total Oregon 33.2% British Columbia 17.8% Oregon 33.2% 28.5% 46.8% 40.3% 45.4% 43.5% 40.6% 44.0% British Columbia 17.8% 15.6% 22.0% 22.0% 22.0% 20.7% 20.7% 21.6% Washington 17.1% Washington 17.1% 15.7% 21.2% 18.5% 21.5% 21.7% 20.0% 22.5% Montana 10.3% Montana 10.3% 8.9% 11.7% 10.8% 15.0% 13.9% 13.2% 18.1% Colorado 9.4% Colorado 9.4% 7.8% 9.4% 9.7% 12.2% 13.5% 10.2% 12.4% Utah 8.1% Utah 8.1% 6.0% 9.0% 8.3% 10.4% 10.8% 9.1% 11.8% Nevada 3.1% 2.3% 1.9% 1.7% 4.5% 5.8% 3.1% 6.8% Wyoming 4.2% Wyoming 4.2% 3.7% 4.3% 4.4% 5.4% 6.0% 5.4% 8.6% Idaho 3.9% Idaho 3.9% 3.3% 4.4% 3.8% 5.8% 6.4% 5.0% 9.3% Nevada 3.1% Base 17762 9155 6975 4884 3769 2616 4020 2196 Question: For each attribute below, rank the top two destinations as the best for each. (Drag the destination on the left into the appropriate space on the right to rank.) Scenic Beauty
DESTINATION RATING WELCOMING Figure 33: Statewide Welcoming Importance Detail by Region Mt. Hood/ Columbia River Gorge Portland Region Oregon Coast Willamette Valley Central Oregon Southern Oregon Eastern Oregon Oregon 34.0% Total Washington 20.3% Oregon 34.0% 29.1% 46.1% 42.1% 45.3% 43.0% 40.9% 43.4% British Columbia 14.8% Washington 20.3% 18.2% 25.8% 23.1% 26.2% 25.7% 24.3% 25.4% British Columbia 14.8% 13.5% 17.6% 17.5% 18.4% 17.7% 16.7% 20.3% Colorado 9.6% Colorado 9.6% 8.5% 10.8% 10.1% 13.0% 13.7% 12.4% 14.6% Montana 7.2% Montana 7.2% 5.5% 7.5% 7.2% 10.1% 10.2% 8.5% 12.4% Idaho 6.0% Idaho 6.0% 4.6% 6.8% 5.7% 8.4% 9.7% 7.3% 11.6% Nevada 5.5% Nevada 5.5% 4.7% 6.0% 4.3% 7.3% 8.2% 6.2% 9.5% Utah Utah 4.1% 3.5% 4.3% 3.6% 5.5% 6.3% 4.6% 8.3% 4.1% Wyoming 3.8% 3.1% 3.6% 3.6% 5.3% 6.1% 5.0% 8.1% Wyoming 3.8% Base 17762 9155 6975 4884 3769 2616 4020 2196 Question: For each attribute below, rank the top two destinations as the best for each. (Drag the destination on the left into the appropriate space on the right to rank.) Welcoming and inclusive environment
DESTINATION ATTRIBUTE RATING UNIQUE Figure 34: Statewide Uniqueness Importance Detail by Region Mt. Hood/ Columbia River Gorge Portland Region Oregon Coast Willamette Valley Central Oregon Southern Oregon Eastern Oregon Oregon 24.6% Total British Columbia 18.5% Oregon 24.6% 21.6% 34.7% 29.8% 33.4% 32.4% 30.1% 32.4% Utah 15.8% British Columbia 18.5% 16.5% 23.2% 22.4% 23.1% 22.7% 21.4% 24.1% Utah 15.8% 12.1% 18.8% 16.3% 21.2% 21.5% 18.7% 23.4% Washington 10.5% Washington 10.5% 9.5% 12.9% 11.1% 13.0% 13.1% 12.9% 15.6% Montana 9.2% Montana 9.2% 7.7% 9.7% 9.7% 12.5% 13.5% 11.3% 13.7% Colorado 8.2% Colorado 8.2% 7.1% 8.7% 8.9% 9.9% 11.3% 10.0% 11.6% Wyoming 7.3% 6.2% 8.5% 7.6% 9.7% 10.8% 8.2% 12.7% Wyoming 7.3% Nevada 6.6% 6.1% 7.1% 6.6% 9.2% 8.9% 7.1% 11.5% Nevada 6.6% Idaho 4.2% 3.4% 4.6% 4.4% 7.0% 5.6% 5.5% 8.3% Base 17762 9155 6975 4884 3769 2616 4020 2196 Idaho 4.2% Question: For each attribute below, rank the top two destinations as the best for each. (Drag the destination on the left into the appropriate space on the right to rank.) Uniqueness
ENVIRONMENTAL IMPACT IMPORTANCE Figure 35: Statewide Travel Impact on Environment Importance 70.8% 69.5% 69.0% 68.7% 67.6% 66.3% 64.5% 63.7% 27.7% 28.1% 30.5% 22.3% 28.5% 26.4% 35.6% 21.7% Very important Important 42.2% 42.0% 41.3% 40.6% 39.9% 39.1% 39.0% 35.2% Total Portland Region Oregon Coast Willamette Valley Central Oregon Southern Oregon Mt. Hood/ Columbia River Gorge Eastern Oregon Question: When planning your trips, how important to you is the impact of your travel on the environment? (Select one)
OREGON FAMILIARITY RATING Figure 36: Oregon Familiarity Rating by Region 97.5% 97.4% 97.2% 96.9% 96.9% 96.3% 95.9% 95.8% 37.6% 37.8% 41.6% 38.9% 39.8% 43.3% 43.2% 47.9% Very familiar Familiar 35.0% 36.3% 35.1% 34.3% 34.8% 35.2% 33.8% Somewhat familiar 33.6% 24.1% 23.3% 22.2% 21.8% 21.0% 18.9% 18.4% 16.0% Total Portland Region Oregon Coast Willamette Valley Central Oregon Southern Oregon Mt. Hood/ Columbia River Gorge Eastern Oregon Question: How familiar are you with the things to see and do in Oregon?