Ohio Crash Trends 2021: Analysis of Fatalities and Serious Injuries


Ohio Crash Trends

■
2021 Crash Trends


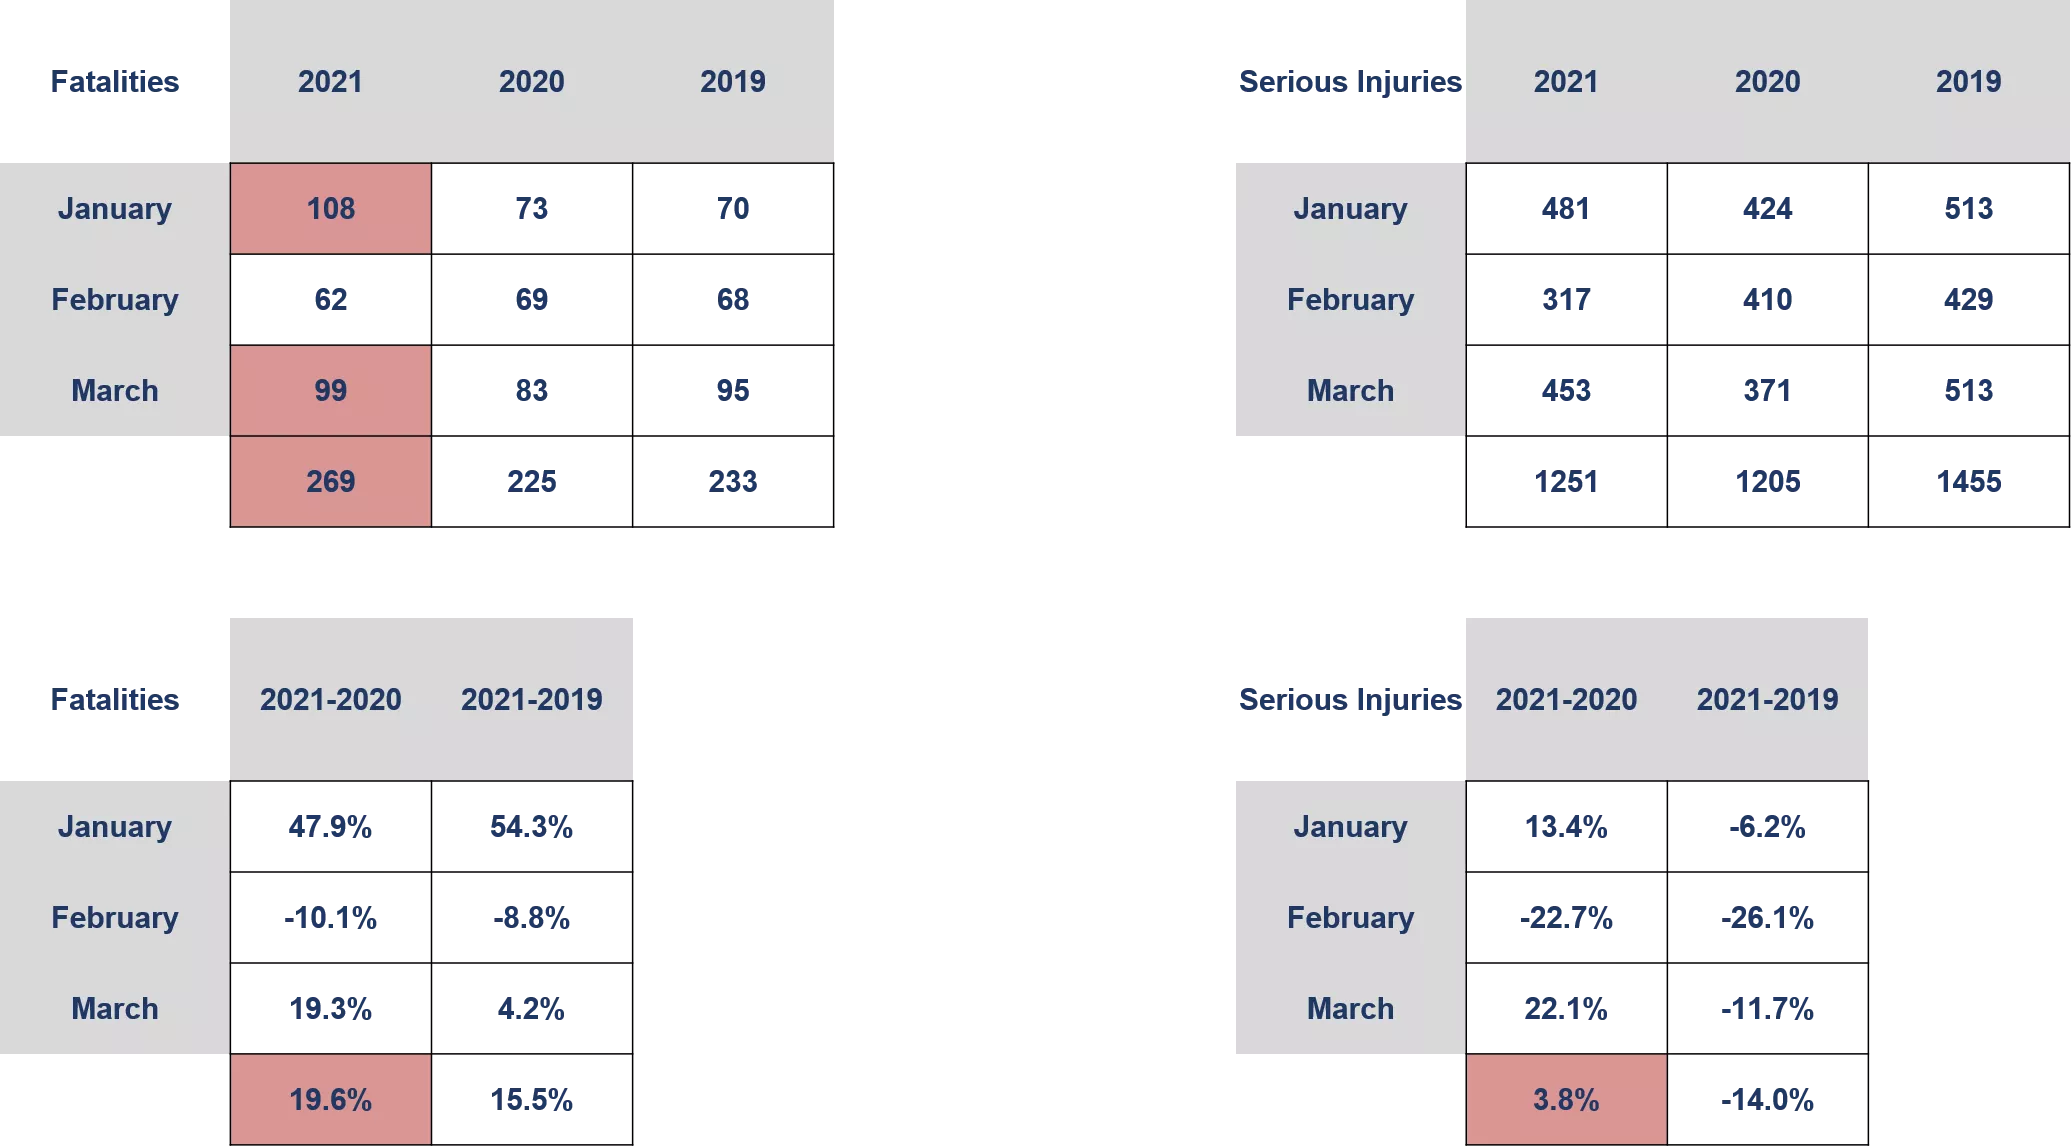
2021 Fatalities and Serious Injuries


O
h
i
o
T
r
a
f
f
i
c
D
e
a
t
h
s
2
0
0
0
–
2
0
2
0
O
h
i
o
T
r
a
f
f
i
c
D
e
a
t
h
s
T
o
D
a
t
e
2
0
0
8
–
2
0
2
1
O
h
i
o
C
r
a
s
h
e
s
T
o
D
a
t
e
*
2
0
2
1
p
r
e
l
i
m
i
n
a
r
y
2021 Analysis – Fatalities
2021 Analysis – Serious Injuries
How does Ohio compare?
How does Ohio compare?
Distracted Driving
•
Confirmed distracted driving cases has decreased with
Other/Unknown Option
•
In 2021 we have 2153 distracted driving crashes and 5786
Possible distracted driving
•
Age of distracted driver has been decreasing
Distracted Driving (Fatals)
•
Other/Unknown Distracted Driving has increased needing
investigation
•
In 2021 56.4% of all fatalities marked as distracted or
unknown needing investigation
•
Average Age of Fatal Distracted Driver is increasing
Wrong Way
•
Average Age of Wrong Way Driver has decreased
•
In 2021 we have 23 wrong way crashes.
•
Yearly average around 80 wrong way crashes
Freeway Message Sign Update
Website
Freeway Message Sign Update
Website
Pandemic Impacts on FSI Crashes
Pandemic Impacts on FSI Crashes
Intersections
•
Notable changes….
–
47.7% increase in fatalities at intersections in
urban areas
–
46.8% increase in fatalities at
signalized intersections
–
46.1% increase in fatalities as a result of
angle crashes
–
92.3% increase in fatalities from
4PM-5PM
and a 108.3% increase
in fatalities from
6PM-7PM
–
34.4% increase in fatalities and 48.3% increase in serious injuries in
crashes noted to be
speed-related
Pandemic Impacts on FSI Crashes
Pedestrians
•
Notable changes….
•
37.8% increase in pedestrian fatalities in
urban areas
•
31.4% increase in pedestrian fatalities along
arterials
•
60% increase in
speed-related
pedestrian fatalities
•
84% increase in pedestrian fatalities crossing at an
unmarked, midblock
location
•
A 600% increase in pedestrian fatalities crossing at an
unmarked crosswalk at
an intersection
•
Note – Total went from 2 fatalities in 2019 to 14 in 2020 (+12)
•
40.5% increase in pedestrian fatalities where the posted
speed limit is 35 mph
Detailed analysis of Ohio traffic fatalities and serious injuries in 2021 reveals trends and percentages across different categories such as roadway departure, intersection incidents, alcohol-related cases, involvement of young and older drivers, distracted driving, and more. The data also includes comparisons with statistics from 2020 and 2019.

Download Presentation

Please find below an Image/Link to download the presentation.
The content on the website is provided AS IS for your information and personal use only. It may not be sold, licensed, or shared on other websites without obtaining consent from the author. Download presentation by click this link. If you encounter any issues during the download, it is possible that the publisher has removed the file from their server.
E N D
Presentation Transcript
Ohio Crash Trends 2021 Crash Trends
2021 Fatalities and Serious Injuries Fatalities 2021 2020 2019 Serious Injuries 2021 2020 2019 January 108 73 70 January 481 424 513 February 62 69 68 February 317 410 429 March 99 83 95 March 453 371 513 269 225 233 1251 1205 1455 Fatalities 2021-2020 2021-2019 Serious Injuries 2021-2020 2021-2019 January 47.9% 54.3% January 13.4% -6.2% February -10.1% -8.8% February -22.7% -26.1% March 19.3% 4.2% March 22.1% -11.7% 19.6% 15.5% 3.8% -14.0%
Ohio Traffic Deaths To Date 2008 2021 300 269 260 240 250 238 233 225 222 220 216 197 200 189 188 187 182 150 100 50 0 2008 2009 2010 2011 2012 2013 2014 2015 2016 2017 2018 2019 2020 2021
2021 Analysis Fatalities 2021 2021 2020 2020 2019 2019 Target Group % of Total Fatalities % of Total Fatalities % of Total Fatalities Fatalities Fatalities Fatalities Total Fatalities by Year Roadway Departure Intersection Railroad Crossing Alcohol Related Involvement Restraints Not Used Driver/Occupants Speed Related Involvement Young Driver Involvement (15-25) Older Driver Involvement (65+) Distracted Drivers Commercial Motor Vehicle (CMV) Involvement Motorcycle Driver/Passenger Pedestrian Bicycle Work Zone Related Drug Related Involvement Rear End 218 111 73 0 35 89 67 68 38 5 30 10 32 2 2 25 14 225 131 45 3 82 87 55 53 45 9 27 13 34 2 2 93 16 233 136 43 2 83 88 66 68 57 9 35 6 32 1 3 89 11 51% 33% 0% 16% 41% 31% 31% 17% 2% 14% 5% 15% 1% 1% 11% 6% 58% 20% 1% 36% 39% 24% 24% 20% 4% 12% 6% 15% 1% 1% 41% 7% 58% 18% 1% 36% 38% 28% 29% 24% 4% 15% 3% 14% 0% 1% 38% 5%
2021 Analysis Serious Injuries 2021 2021 2020 2020 2019 2019 % of Total Serious Injuries % of Total Serious Injuries % of Total Serious Injuries Target Group Serious Injuries Serious Injuries Serious Injuries Total Serious Injuries by Year Roadway Departure Intersection Railroad Crossing Alcohol Related Involvement Restraints Not Used Driver/Occupants Speed Related Involvement Young Driver Involvement (15-25) Older Driver Involvement (65+) Distracted Drivers Commercial Motor Vehicle (CMV) Involvement Motorcycle Driver/Passenger Pedestrian Bicycle Work Zone Related Drug Related Involvement Rear End 1,251 617 441 0 205 325 350 462 174 68 82 84 92 18 11 92 123 1,205 552 509 3 213 282 303 394 197 57 89 50 115 9 6 112 113 1,455 693 571 3 238 295 364 425 258 81 145 36 110 4 13 118 146 49% 35% 0% 16% 26% 28% 37% 14% 5% 7% 7% 7% 1% 1% 7% 10% 46% 42% 0% 18% 23% 25% 33% 16% 5% 7% 4% 10% 1% 0% 9% 9% 48% 39% 0% 16% 20% 25% 29% 18% 6% 10% 2% 8% 0% 1% 8% 10%
Distracted Driving Confirmed distracted driving cases has decreased with Other/Unknown Option In 2021 we have 2153 distracted driving crashes and 5786 Possible distracted driving Age of distracted driver has been decreasing Average Distracted/Suspected Driver Age Year Not Distracted Distracted Distracted & Unknown 2012 33 240628 98.8% 2011 0.8% 2011 0.8% 2013 34 205895 92.4% 11816 5.3% 11816 5.3% 2014 34 218329 92.6% 12132 5.1% 12132 5.1% 2015 34 232659 92.4% 13210 5.2% 13210 5.2% 2016 34 236885 92.0% 14025 5.4% 14025 5.4% 2017 34 234914 92.1% 13729 5.4% 13729 5.4% 2018 35 229040 92.0% 13453 5.4% 13453 5.4% 2019 24 197143 76.7% 12999 5.1% 39525 15.4% 2020 23 154538 72.8% 10576 5.0% 39293 18.5% 2021 22 34297 75.2% 2153 4.7% 7939 17.4%
Distracted Driving (Fatals) Other/Unknown Distracted Driving has increased needing investigation In 2021 56.4% of all fatalities marked as distracted or unknown needing investigation Average Age of Fatal Distracted Driver is increasing Average Distracted/Suspected Driver Age Year Not Distracted Distracted Distracted & Unknown 2012 896 99.4% 5 0.6% 5 0.6% 45 2013 774 94.5% 32 3.9% 32 3.9% 31 2014 790 95.1% 34 4.1% 34 4.1% 36 2015 873 94.7% 39 4.2% 39 4.2% 36 2016 873 95.4% 25 2.7% 25 2.7% 37 2017 901 93.2% 47 4.9% 47 4.9% 32 2018 803 93.8% 43 5.0% 43 5.0% 42 2019 440 47.6% 38 4.1% 457 49.5% 43 2020 449 44.7% 27 2.7% 523 52.1% 40 2021 65 39.9% 3 1.8% 92 56.4% 42
Wrong Way Average Age of Wrong Way Driver has decreased In 2021 we have 23 wrong way crashes. Yearly average around 80 wrong way crashes Year Average Wrong Way Age To Date Crashes Yearly Crashes 2013 35 15 61 2014 45 13 -13.3% 64 4.9% 2015 39 21 61.5% 66 3.1% 2016 35 22 4.8% 70 6.1% 2017 37 21 -4.5% 69 -1.4% 2018 36 16 -23.8% 83 20.3% 2019 38 22 37.5% 70 -15.7% 2020 34 19 -13.6% 80 14.3% 2021 35 23 21.1%
Freeway Message Sign Update Website Website
Freeway Message Sign Update Website Website ODOT Dates ODOT Campaign January February 5-7 Speed March 12-14 Motorcycle Safety April 2-4 Distracted Driving April 23-25 Work Zone Safety May 16-18 Speed May 28-30 Occupant Protection June 18-21 Motorcycle Safety July 2-5 Impaired Driving August 6-8 Speed August 20-22 Move Over September 4-6 Impaired Driving September 17-19 Work Zone Safety October 22-24 Distracted Driving November 24-28 Occupant Protection December 10-12 Distracted Driving December 24-26 Impaired Driving
Pandemic Impacts on FSI Crashes 2019 Traffic Deaths 2020 Traffic Deaths % Change Overall 1,155 1,229 +6.4% Intersection 246 309 +25.6% Pedestrian 126 164 +30.2%
Pandemic Impacts on FSI Crashes Intersections Notable changes . 47.7% increase in fatalities at intersections in urban areas 46.8% increase in fatalities at signalized intersections 46.1% increase in fatalities as a result of angle crashes 92.3% increase in fatalities from 4PM-5PM and a 108.3% increase in fatalities from 6PM-7PM 34.4% increase in fatalities and 48.3% increase in serious injuries in crashes noted to be speed-related
Pandemic Impacts on FSI Crashes Pedestrians Notable changes . 37.8% increase in pedestrian fatalities in urban areas 31.4% increase in pedestrian fatalities along arterials 60% increase in speed-related pedestrian fatalities 84% increase in pedestrian fatalities crossing at an unmarked, midblock location A 600% increase in pedestrian fatalities crossing at an unmarked crosswalk at an intersection Note Total went from 2 fatalities in 2019 to 14 in 2020 (+12) 40.5% increase in pedestrian fatalities where the posted speed limit is 35 mph


")