NBA Defense Evaluation Using Machine Learning
Explore the attributes influencing NBA defensive effectiveness through a machine learning examination conducted by Alex Block Advisors, Chris Fernandes, and Nick Webb. The study analyzes various factors such as shooting percentage, turnovers, offensive rebounding, and free throws. Data from the 1996-1997 season to the present is used to measure defensive efficiency and apply machine learning algorithms like Linear Regression and Multilayer Perceptron. Attribute selection plays a crucial role in determining defensive effectiveness.
Download Presentation

Please find below an Image/Link to download the presentation.
The content on the website is provided AS IS for your information and personal use only. It may not be sold, licensed, or shared on other websites without obtaining consent from the author.If you encounter any issues during the download, it is possible that the publisher has removed the file from their server.
You are allowed to download the files provided on this website for personal or commercial use, subject to the condition that they are used lawfully. All files are the property of their respective owners.
The content on the website is provided AS IS for your information and personal use only. It may not be sold, licensed, or shared on other websites without obtaining consent from the author.
E N D
Presentation Transcript
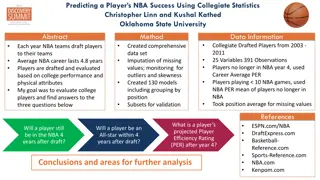
MACHINE LEARNING EXAMINATION OF NBA DEFENSE Alex Block Advisors: Chris Fernandes & Nick Webb
Project Goal Determine the attributes that are most characteristic of defensive effectiveness
Dean Oliver Specifically, at the NBA level, the general ranking of importance of the Four Factors is 1. Shooting percentage (40%) 2. Turnovers per possession (25%) 3. Offensive rebounding percentage (20%) 4. Getting to the foul line (15%)
Process Outline Gather Data Attribute Selection Model Data Analyze
Data Data gathered for all teams from the 1996-1997 to the present season 65 Initial Statistics Gather Data Attribute Selection Model data Analyze
Measuring Defense Defensive Efficiency Points normalized by 100 possessions Gather Data Attribute Selection Model Data Analyze
Machine Learning Weka Apply every available algorithm to the data Gather complete set of data Best Performing Algorithms Linear Regression Multilayer Perceptron Model data with Machine Learning Attribute Selection Analyze
Linear Regression y = a + b1x1 + b2x2 bnxn Gather data Attribute Selection Model Data Correlation Coefficient: 0.9997 Analyze
Multilayer Perceptron (Neural Network) Gather Data Attribute Selection Model Data Correlation Coefficient: 0.9993 Analyze
Attribute Selection Attribute is not an indicator of defense an indicator of defensive effectiveness, but not a cause of it highly correlated with another attribute a composite of other attributes not important for the success of the model Gather Data Attribute Selection Model Data Analyze
Final Attribute Set (Ranked by Importance) Correlation Coefficient Initial Opponent Turnover Ratio Restricted Area Field Goal % Defensive Rebound % Mid-Range Field Goal % Opponent Free Throw Attempt Ratio In The Paint (Non-RA) Field Goal % Above the Break 3 Field Goal % In The Paint (Non-RA) Field Goal Attempts Mid-Range Field Goal Attempts 1. 2. 3. 4. 5. 6. 7. 8. 9. 10. Restricted Area Field Goal Attempts 11. Opponent Free Throw % 12. Left Corner 3 Field Goal % 13. Right Corner 3 Field Goal % 14. Above the Break 3 Field Goal Attempts 15. Right Corner 3 Field Goal Attempts 16. Left Corner 3 Field Goal Attempts Final Multilayer Perceptron Linear Regression .9993 .9952 .9997 .9816
My Statistics Dean Oliver s Opp TO Ratio Restricted Area FG Percentage DREB Percentage Mid-Range FG Percentage Opp FTA Rate In The Paint (Non-RA) FG Percentage Above the Break 3 FG Percentage In The Paint (Non-RA) FGA Mid-Range FGA Restricted Area FGA Opp FT Percentage Left Corner 3 FG Percentage Right Corner 3 FG Percentage Above the Break 3 FGA Right Corner 3 FGA Left Corner 3 FGA 1. 2. 3. 4. 5. 6. 7. 8. 9. 10. 11. 12. 13. 14. 15. 16. 1. 2. 3. 4. Shooting percentage Turnovers per possession Offensive rebounding percentage Getting to the foul line
My Statistics Dean Oliver s Opp TO Ratio Restricted Area FG Percentage DREB Percentage Mid-Range FG Percentage Opp FTA Rate In The Paint (Non-RA) FG Percentage Above the Break 3 FG Percentage In The Paint (Non-RA) FGA Mid-Range FGA Restricted Area FGA Opp FT Percentage Left Corner 3 FG Percentage Right Corner 3 FG Percentage Above the Break 3 FGA Right Corner 3 FGA Left Corner 3 FGA 1. 2. 3. 4. 5. 6. 7. 8. 9. 10. 11. 12. 13. 14. 15. 16. 1. 2. 3. 4. Shooting percentage Turnovers per possession Offensive rebounding percentage Getting to the foul line
My Statistics Dean Oliver s Opp TO Ratio Restricted Area FG Percentage DREB Percentage Mid-Range FG Percentage Opp FTA Rate In The Paint (Non-RA) FG Percentage Above the Break 3 FG Percentage In The Paint (Non-RA) FGA Mid-Range FGA Restricted Area FGA Opp FT Percentage Left Corner 3 FG Percentage Right Corner 3 FG Percentage Above the Break 3 FGA Right Corner 3 FGA Left Corner 3 FGA 1. 2. 3. 4. 5. 6. 7. 8. 9. 10. 11. 12. 13. 14. 15. 16. 1. 2. 3. 4. Shooting percentage Turnovers per possession Offensive rebounding percentage Getting to the foul line
My Statistics Dean Oliver s Opp TO Ratio Restricted Area FG Percentage DREB Percentage Mid-Range FG Percentage Opp FTA Rate In The Paint (Non-RA) FG Percentage Above the Break 3 FG Percentage In The Paint (Non-RA) FGA Mid-Range FGA Restricted Area FGA Opp FT Percentage Left Corner 3 FG Percentage Right Corner 3 FG Percentage Above the Break 3 FGA Right Corner 3 FGA Left Corner 3 FGA 1. 2. 3. 4. 5. 6. 7. 8. 9. 10. 11. 12. 13. 14. 15. 16. 1. 2. 3. 4. Shooting percentage Turnovers per possession Offensive rebounding percentage Getting to the foul line
My Statistics Dean Oliver s Opp TO Ratio Restricted Area FG Percentage DREB Percentage Mid-Range FG Percentage Opp FTA Rate In The Paint (Non-RA) FG Percentage Above the Break 3 FG Percentage In The Paint (Non-RA) FGA Mid-Range FGA Restricted Area FGA Opp FT Percentage Left Corner 3 FG Percentage Right Corner 3 FG Percentage Above the Break 3 FGA Right Corner 3 FGA Left Corner 3 FGA 1. 2. 3. 4. 5. 6. 7. 8. 9. 10. 11. 12. 13. 14. 15. 16. 1. 2. 3. 4. Shooting percentage Turnovers per possession Offensive rebounding percentage Getting to the foul line
Attribute Weights Removed each attribute individually and tracked the change in the Correlation Coefficient Summed the individual changes in Correlation Divided the individual change by the total change and multiplied by 100 Weights are a percentage of 100
Attribute Weights Opp TO Ratio Restricted Area FG Percentage DREB Percentage Mid-Range FG Percentage Opp FTA Rate In The Pain (Non-RA) FG Percentage Above the Break 3 FG Percentage In The Pain (Non-RA) FGA Mid-Range FGA Restricted Area FGA Opp FT Percentage Left Corner 3 FG Percentage Right Corner 3 FG Percentage Above the Break 3 FGA Right Corner 3 FGA Left Corner 3 FGA 27.55453502 25.83237658 13.37543054 8.811710677 6.601607348 4.592422503 4.47761194 1.607347876 1.463834673 1.377726751 1.205510907 0.975889782 0.918484501 0.861079219 0.229621125 0.114810563
Attribute Weights Dean Oliver Alex Block 40% 25% Shooting Percentage Turnovers Per Possession Offensive Rebounding Percentage Getting to the Foul Line 53.4% 27.6% 20% 13.4% 15% 6.6% Gather Data Attribute Selection Model Data Analyze
Attempts vs. Percentage Brad Stevens (Boston Celtics Coach) on the difference between college and NBA defense In college, we really focus on who shoots the ball. In the NBA, there is much more of a focus on where they shoot from.
Attempts vs. Percentage Restricted Area FG Percentage Mid-Range FG Percentage In The Paint (Non-RA) FG Percentage Above the Break 3 FG Percentage In The Pain (Non-RA) FGA Mid-Range FGA Restricted Area FGA Left Corner 3 FG Percentage Right Corner 3 FG Percentage Above the Break 3 FGA Right Corner 3 FGA Left Corner 3 FGA 25.83237658 8.811710677 4.592422503 4.47761194 1.607347876 1.463834673 1.377726751 0.975889782 0.918484501 0.861079219 0.229621125 0.114810563
Attempts vs. Percentage The Opponent s FG Percentage is more important than the Attempts for every zone Explanation: Little variation in attempts compared to the variations in percentage Confirmation: Correlation Coefficient Removing all FGA Removing all FG% 0.9301 0.7826
Important Zones to Defend Restricted Area Mid-Range In The Paint (Non-RA) Above the Break 3 Corner 3 These are the differentiators between good/bad defense Not necessarily the ranked list of most important areas to defend
Future work Attribute Weights by Year Has the 3 Pointer become more important? Integrating players and player statistics Evaluating offense using the same process
