MONETARY-BASED POVERTY MEASUREMENT


M
O
N
E
T
A
R
Y
-
B
A
S
E
D
P
O
V
E
R
T
Y
M
E
A
S
U
R
E
M
E
N
T
Kristen Himelein
Senior Economist / Statistician
October 30, 2019

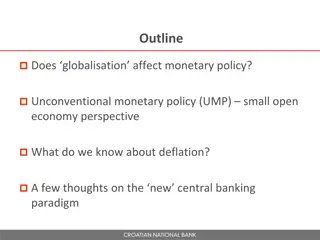
RECOMMENDATIONS FOR THE PACIFIC


INTRODUCTION TO MONETARY POVERTY
1
•
Poverty
is an incredibly complex and culturally specific concept which is hard
to quantify for a single country much less develop a measure which permits
comparisons across disparate contexts across the world.
•
Comparable measures are needed though to
monitor global progress
in
poverty reduction and for development partners and governments to
target
interventions
.
•
One measure that is used to inform these decisions is
monetary poverty
,
which can be based on either income or consumption.

MONETARY POVERTY & THE SDGS
2
S
D
G
1
.
1
.
1
.
P
r
o
p
o
r
t
i
o
n
o
f
p
o
p
u
l
a
t
i
o
n
b
e
l
o
w
t
h
e
i
n
t
e
r
n
a
t
i
o
n
a
l
p
o
v
e
r
t
y
l
i
n
e
,
b
y
s
e
x
,
a
g
e
,
e
m
p
l
o
y
m
e
n
t
s
t
a
t
u
s
a
n
d
g
e
o
g
r
a
p
h
i
c
a
l
l
o
c
a
t
i
o
n
.
The
international poverty line
allows countries to understand their relative level of poverty
compared to the rest of the world.
S
D
G
1
.
2
.
1
.
P
r
o
p
o
r
t
i
o
n
o
f
p
o
p
u
l
a
t
i
o
n
l
i
v
i
n
g
b
e
l
o
w
t
h
e
n
a
t
i
o
n
a
l
p
o
v
e
r
t
y
l
i
n
e
,
b
y
s
e
x
a
n
d
a
g
e
.
The
national monetary poverty line
is a line that is appropriate to one specific country and allows
policymakers in that country to understand
patterns of poverty within the country and to
measure progress over time
.
S
D
G
1
.
2
.
2
.
P
r
o
p
o
r
t
i
o
n
o
f
m
e
n
,
w
o
m
e
n
a
n
d
c
h
i
l
d
r
e
n
o
f
a
l
l
a
g
e
s
l
i
v
i
n
g
i
n
p
o
v
e
r
t
y
i
n
a
l
l
i
t
s
d
i
m
e
n
s
i
o
n
s
a
c
c
o
r
d
i
n
g
t
o
n
a
t
i
o
n
a
l
d
e
f
i
n
i
t
i
o
n
s
.
The
non-monetary poverty measure
is also used to understand relative deprivation within a
country, but using a culturally specific definition that covers aspects of poverty that are not
directly related to household finances.
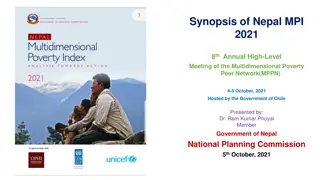
GLOBAL POVERTY MONITORING
3
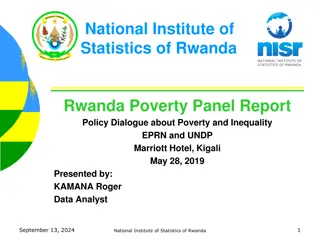
The World Bank monitors
global poverty reduction
through the
international
poverty line (IPL) USD 1.90
per person per day.
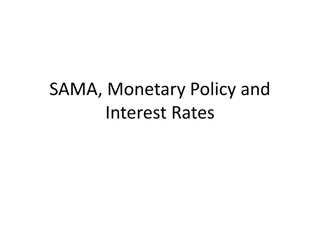
BACKGROUND OF THE IPL
4
•
An International Poverty Line (IPL) is
necessary since national poverty lines
vary according to national context (i.e.
richer countries tend to have higher
poverty lines
).
•
The original line $1 per day IPL was
developed as the simple average of the
poverty lines for the 15 poorest countries
for which data was available. A
robustness check conducted in 2015 for
the 15 poorest countries for which data
was available gave exactly $1.90 as well.
Source: Jolliffe & Prydz (2016)
NATIONAL POVERTY MONITORING
5
The IPL is not necessarily useful for domestic policy recommendations –
particularly in the Pacific where IPL values are quite low for many countries.
In order to develop a national measure of monetary poverty, an analyst requires
two types of data:
1.
A consumption aggregate
2.
A cost-of-basic-needs poverty line
*
* Some countries use income instead of consumption (Fiji) but the basic calculations remain the same.
NATIONAL POVERTY MONITORING
6
Each household has its own
consumption
aggregate
. When these values are graphed,
the result is the
consumption distribution
.
The poverty line crosses the consumption
distribution and
all those living below the
poverty line are considered poor
.
The World Bank recommends a
Cost-of-
Basic-Needs
poverty line which is based in a
basket of food actually consumed by poor
people.
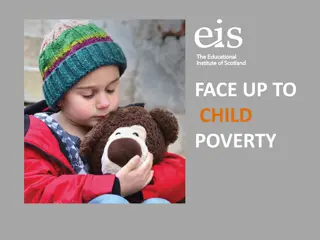
CONSUMPTION AGGREGATES
7
Generally in the Pacific…
* Based on RMI experiment only
With transfers out of the household
(gifts given) being approximately 5%.
RECOMMENDATIONS
8
1.
SDG 1.1.1 should be measured using the USD 1.90 PPP per capita per day
International Poverty Line. SDG 1.2.1 should be measured using a national cost-of-
basic-needs poverty line based in national survey data.
2.
Food consumption should include purchases (including prepared meals and food
consumed away from home), gifts received, food provided in-kind, home production,
and rations.
3.
N
o
n
-
f
o
o
d
c
o
n
s
u
m
p
t
i
o
n
s
h
o
u
l
d
i
n
c
l
u
d
e
t
h
e
u
s
e
v
a
l
u
e
o
f
a
s
s
e
t
s
,
i
m
p
u
t
e
d
r
e
n
t
,
e
d
u
c
a
t
i
o
n
s
p
e
n
d
i
n
g
,
h
e
a
l
t
h
s
p
e
n
d
i
n
g
o
n
p
r
e
v
e
n
t
a
t
i
v
e
a
n
d
e
l
e
c
t
i
v
e
p
r
o
c
e
d
u
r
e
s
,
b
u
t
e
x
c
l
u
d
e
“
l
u
m
p
y
”
e
x
p
e
n
d
i
t
u
r
e
s
,
i
n
v
e
s
t
m
e
n
t
,
l
o
a
n
s
,
i
n
t
e
r
e
s
t
,
t
a
x
e
s
,
a
n
d
t
r
a
n
s
f
e
r
s
o
u
t
o
f
t
h
e
h
o
u
s
e
h
o
l
d
(
i
n
c
l
u
d
i
n
g
g
i
f
t
s
,
r
e
m
i
t
t
a
n
c
e
s
,
a
n
d
r
e
l
i
g
i
o
u
s
c
o
n
t
r
i
b
u
t
i
o
n
s
)
.
4.
Calculations for imputed rent should account for local price differences and
compensate for owners’ tendencies to overvalue their dwelling.
RECOMMENDATIONS
9
5.
Countries should continue to use the OECD per adult equivalent instead of per
capita measures to adjust the consumption aggregate for household composition.
6.
Household composition should be further adjusted take into account partakers.
7.
The reference population for the consumption basket should always exclude the top
and bottom decile, and otherwise use an iterative approach to determine the correct
part of the distribution.
8.
Poverty analysis should use the FGT measures, including poverty headcount,
poverty gap, and poverty severity.
9.
All data cleaning and calculations should be done using replicable methods in a
statistical analysis program such as Stata or R. The do / R studio files should be
retained and archived along with the dataset.
OUTSTANDING QUESTIONS
10
1.
How should home production be priced? Unit values? Market survey? Other?
2.
When calculating the number of calories per 100g of prepared meals, should a
multiplier be used? If so, how should the value be determined?
3.
Should urgent care health spending be included in the non-food consumption
aggregate?
4.
What method should be adopted with regard to price deflators?
5.
Should there be a regional caloric requirement? How should that value be set?
6.
What method should be used for calculating the non-food component of the poverty
line?
7.
How should the poverty line be adjusted over time?
NEXT STEPS
11
1.
The World Bank will do further investigation of the outstanding issues listed in the
previous slide, with a timeline to have the results compiled and peer reviewed prior
to the April 2020 Pacific Statistics Methods Board meeting in Auckland.
2.
Once the recommendations are finalized, the World Bank, in partnership with SPC,
will develop a set of training materials
(including a dummy dataset and example
Stata / R code), and initiate a program of training in the region, prioritizing those
countries with recently completed, or soon to be completed HIES.
3.
Further training and dissemination of the results will also take place in partnership
with UNITAR.
Poverty is a complex concept, especially in the Pacific region, requiring monetary poverty measures for global progress tracking. Learn about income vs. consumption-based poverty measures, SDG alignments, global poverty monitoring, IPL background, and national poverty monitoring needs.

Download Presentation

Please find below an Image/Link to download the presentation.
The content on the website is provided AS IS for your information and personal use only. It may not be sold, licensed, or shared on other websites without obtaining consent from the author.If you encounter any issues during the download, it is possible that the publisher has removed the file from their server.
You are allowed to download the files provided on this website for personal or commercial use, subject to the condition that they are used lawfully. All files are the property of their respective owners.
The content on the website is provided AS IS for your information and personal use only. It may not be sold, licensed, or shared on other websites without obtaining consent from the author.
E N D
Presentation Transcript
MONETARY-BASED POVERTY MEASUREMENT RECOMMENDATIONS FOR THE PACIFIC Kristen Himelein Senior Economist / Statistician October 30, 2019
INTRODUCTION TO MONETARY POVERTY Poverty is an incredibly complex and culturally specific concept which is hard to quantify for a single country much less develop a measure which permits comparisons across disparate contexts across the world. Comparable measures are needed though to monitor global progress in poverty reduction and for development partners and governments to target interventions. One measure that is used to inform these decisions is monetary poverty, which can be based on either income or consumption. 1
MONETARY POVERTY & THE SDGS SDG 1.1.1. Proportion of population below the international poverty line, by sex, age, employment status and geographical location. The international poverty line allows countries to understand their relative level of poverty compared to the rest of the world. SDG 1.2.1. Proportion of population living below the national poverty line, by sex and age. The national monetary poverty line is a line that is appropriate to one specific country and allows policymakers in that country to understand patterns of poverty within the country and to measure progress over time. SDG 1.2.2. Proportion of men, women and children of all ages living in poverty in all its dimensions according to national definitions. The non-monetary poverty measure is also used to understand relative deprivation within a country, but using a culturally specific definition that covers aspects of poverty that are not directly related to household finances. 2
GLOBAL POVERTY MONITORING The World Bank monitors global poverty reduction through the international poverty line (IPL) USD 1.90 per person per day. 90 80 70 60 50 40 1 World 30 2 East Asia & Pacific 3 Latin America & Caribbean 20 4 Middle East & North Africa 10 5 Sub-Saharan Africa 0 6 Europe & Central Asia 1981 1987 1993 1999 2005 2010 2012 2015 3
BACKGROUND OF THE IPL An International Poverty Line (IPL) is necessary since national poverty lines vary according to national context (i.e. richer countries tend to have higher poverty lines). The original line $1 per day IPL was developed as the simple average of the poverty lines for the 15 poorest countries for which data was available. A robustness check conducted in 2015 for the 15 poorest countries for which data was available gave exactly $1.90 as well. Source: Jolliffe & Prydz (2016) 4
NATIONAL POVERTY MONITORING The IPL is not necessarily useful for domestic policy recommendations particularly in the Pacific where IPL values are quite low for many countries. In order to develop a national measure of monetary poverty, an analyst requires two types of data: 1. A consumption aggregate 2. A cost-of-basic-needs poverty line * * Some countries use income instead of consumption (Fiji) but the basic calculations remain the same. 5
NATIONAL POVERTY MONITORING Each household has its own consumption aggregate. When these values are graphed, the result is the consumption distribution. The poverty line crosses the consumption distribution and all those living below the poverty line are considered poor. The World Bank recommends a Cost-of- Basic-Needs poverty line which is based in a basket of food actually consumed by poor people. 6
CONSUMPTION AGGREGATES Generally in the Pacific Rent 20% Durables* 2% Non-food 35% Other 5% Education 2% Health 1% Food 40% With transfers out of the household (gifts given) being approximately 5%. * Based on RMI experiment only 7
RECOMMENDATIONS 1. SDG 1.1.1 should be measured using the USD 1.90 PPP per capita per day International Poverty Line. SDG 1.2.1 should be measured using a national cost-of- basic-needs poverty line based in national survey data. Food consumption should include purchases (including prepared meals and food consumed away from home), gifts received, food provided in-kind, home production, and rations. Non-food consumption should include the use value of assets, imputed rent, education spending, health spending on preventative and elective procedures, but exclude lumpy expenditures, investment, loans, interest, taxes, and transfers out of the household (including gifts, remittances, and religious contributions). Calculations for imputed rent should account for local price differences and compensate for owners tendencies to overvalue their dwelling. 2. 3. 4. 8
RECOMMENDATIONS 5. Countries should continue to use the OECD per adult equivalent instead of per capita measures to adjust the consumption aggregate for household composition. Household composition should be further adjusted take into account partakers. The reference population for the consumption basket should always exclude the top and bottom decile, and otherwise use an iterative approach to determine the correct part of the distribution. Poverty analysis should use the FGT measures, including poverty headcount, poverty gap, and poverty severity. All data cleaning and calculations should be done using replicable methods in a statistical analysis program such as Stata or R. The do / R studio files should be retained and archived along with the dataset. 6. 7. 8. 9. 9
OUTSTANDING QUESTIONS 1. 2. How should home production be priced? Unit values? Market survey? Other? When calculating the number of calories per 100g of prepared meals, should a multiplier be used? If so, how should the value be determined? Should urgent care health spending be included in the non-food consumption aggregate? What method should be adopted with regard to price deflators? Should there be a regional caloric requirement? How should that value be set? What method should be used for calculating the non-food component of the poverty line? How should the poverty line be adjusted over time? 3. 4. 5. 6. 7. 10
NEXT STEPS 1. The World Bank will do further investigation of the outstanding issues listed in the previous slide, with a timeline to have the results compiled and peer reviewed prior to the April 2020 Pacific Statistics Methods Board meeting in Auckland. Once the recommendations are finalized, the World Bank, in partnership with SPC, will develop a set of training materials (including a dummy dataset and example Stata / R code), and initiate a program of training in the region, prioritizing those countries with recently completed, or soon to be completed HIES. Further training and dissemination of the results will also take place in partnership with UNITAR. 2. 3. 11