Mitigating the Threat of Invasive Non-Native Species
Invasive non-native species cost the UK £1.3 billion annually and pose a significant risk to surface waters. Efforts to address this issue include grants for local action groups, enhancing biosecurity, and research initiatives. Learn about the impacts and measures being taken to combat this environmental threat.

Download Presentation

Please find below an Image/Link to download the presentation.
The content on the website is provided AS IS for your information and personal use only. It may not be sold, licensed, or shared on other websites without obtaining consent from the author. If you encounter any issues during the download, it is possible that the publisher has removed the file from their server.
You are allowed to download the files provided on this website for personal or commercial use, subject to the condition that they are used lawfully. All files are the property of their respective owners.
The content on the website is provided AS IS for your information and personal use only. It may not be sold, licensed, or shared on other websites without obtaining consent from the author.
E N D
Presentation Transcript
Infographic template This template has been designed to enable staff to create on brand infographics. All text fields and graphics have been populated in the following slides to show a working example, therefore please amend the title, introduction statement, stats and supporting text to suit. Please keep the layout, graphics and colours as they are some of this is important to retain adequate accessibility. Choose your preferred slide: slides 2-7 provide options for a set of 8 stats, whereas slides 8-13 are for a set of 6 stats. Slides 14 to 19 contain various on brand icons that you can copy and paste on to the slide you are editing. The Environment Agency brand colours used for the text and images are: Green2 (RGB value of 0/175/65) Blue2 (RGB value of 3/75/137) For date and source references use this format: To export your infographic for use on social media, please choose: Save As > Save as type: PNG Portable Network Graphics Format. The template size has been optimised for Twitter, and a PNG format will ensure that your infographic looks the best quality. If you have any questions regarding the use of this template please contact Sam Jolly in the Delivery Team (020 302 54708) Data correct as of --/--/2018 Updated 25/09/2018
Invasive non-native species 1.3 billion 70% Whats the problem ? is the amount INNS cost every year includes control and eradication, structural damage to infrastructure or loss of production due to presence of INNS of surface waters in England are at risk of deterioration because of invasive non-native species 50% Defra s 25 year plan 1.5 million Whats being done is the amount local action groups received in grants from 2011-2015 to help tackle non-native species has enhancing biosecurity to reduce the spread and impacts of INNS as a key component of it During the last 6 years 3000 What outcomes are being achieved ? non-native species are held on the Non-native Invasive Species Portal, the portal contains information on these species and links to their distribution we have commissioned research to better understand the links between INNS, their ecological impacts and how those impacts are picked up in our assessments of ecological status
READY FOR ECONSULTATION: Invasive non-native species 1.3 billion Graphic showing that 70% of surface waters in England are at risk of deterioration because of invasive non- native species . Graphic also shows is that INNS cost 1.3 billion every year includes control and eradication, structural damage to infrastructure or loss of production due to presence of INNS 70% is the amount INNS cost every year includes control and eradication, structural damage to infrastructure or loss of production due to presence of INNS of surface waters in England are at risk of deterioration because of invasive non-native species Defra s 25 year plan 1.5 million Graphic showing that local action groups received 1.5 million in grants from 2011-2015 to help tackle non- native species. Graphic also shows Defra's 25 year environment plan has enhancing biosecurity to reduce the spread and impacts of INNS as a key component of it is the amount local action groups received in grants from 2011-2015 to help tackle non-native species has enhancing biosecurity to reduce the spread and impacts of INNS as a key component of it During the last 6 years 3000 Graphic shows that 3000 non-native species are held on the Non-native Invasive Species Portal, the portal contains information on these species and links to their distribution. Graphic also shows during the last 6 years we have commissioned research to better understand the links between INNS, their ecological impacts and how those impacts are picked up in our assessments of ecological status we have commissioned research to better understand the links between INNS, their ecological impacts and how those impacts are picked up in our assessments of ecological status non-native species are held on the Non-native Invasive Species Portal, the portal contains information on these species and links to their distribution
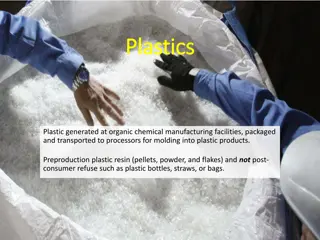
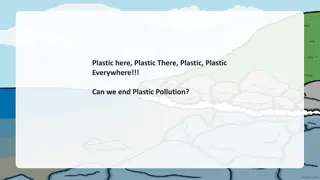
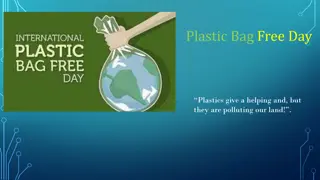
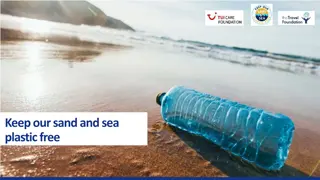
Plastics pollution 4.7- 12.8 million 30% Whats the problem ? metric tonnes of plastic enters the world s oceans every year of plastic on Britain s beaches comes from the public 50% 100% 2018 is the amount of plastic packaging the members of the UK Plastics pact (that represent 85% of plastic packaging sold through supermarkets) are aiming to be re-usable, recyclable or compostable by 2025 was the year when the UK government banned the sale and production of personal care products containing micro- beads Whats being done April 2020 Less than 30% What outcomes are being achieved ? is the year when new regulation on the use of plastic drinking straws, stirrers and cotton buds will come into force Government recommends a tax on plastic packaging containing less than 30% recycled plastic
READY FOR ECONULSTATION: Plastics pollution 4.7- 12.8 million 30% Whats the problem ? of plastic on Britain s beaches comes from the public metric tonnes of plastic enters the world s oceans every year 2018 100% Whats being done is the amount of plastic packaging the members of the UK Plastics pact (that represent 85% of plastic packaging sold through supermarkets) are aiming to be re- usable, recyclable or compostable by 2025 April 2020 was the year when the UK government banned the sale and production of personal care products containing micro- beads Less than 30% What outcomes are being achieved ? Government recommends a tax on plastic packaging containing less than 30% recycled plastic is the year when new regulation on the use of plastic drinking straws, stirrers and cotton buds will come into force
Water levels and flows A D 9% 18% Whats the problem ? of surface water bodies have abstraction and flow pressures preventing them from achieving good status or good ecological potential. of chalk river, water bodies are impacted by abstraction. 18% 26% B E 222,400 of groundwater bodies are at poor status and 0.9 million cubic metres of water per day are needed to recover to good status. million cubic metres of extra water per year will be needed to meet expected population growth by the 2050s. Whats being done C 51 1053 F What outcomes are being achieved ? million cubic metres of water have been returned to the environment through amending abstraction licences million cubic metres of water have been recovered from abstraction licences to remove risk of deterioration.
Water levels and flows 18% 9% Alt text: Graphic shows that 9% of surface water bodies have abstraction and flow pressures preventing them from achieving good status or good ecological potential. Graphic also shows that 18% of chalk river water bodies are impacted by abstraction of surface water bodies have abstraction and flow pressures preventing them from achieving good status or good ecological potential of chalk river water bodies are impacted by abstraction Alt text: Graphic shows that 222,400 million cubic metres of water per year will be needed to meet expected population growth by the 2050s. Graphic also shows that 26% of groundwater bodies are poor and 0.9 million cubic meters of water per day are needed to recover to good. 26% 222,400 of groundwater bodies are at poor status and 0.9 million cubic metres of water per day are needed to recover to good status million cubic metres of extra water per year will be needed to meet expected population growth by the 2050s Alt text: Graphic shows that 51 million cubic meters of water have been returned to the environment. Graphic also shows that 1053 million cubic meters of water have been recovered from abstraction licences to remove risk of deterioration 1053 51 million cubic metres of water have been recovered from abstraction licences to remove risk of deterioration million cubic metres of water have been returned to the environment through amending abstraction licences