MIDSEMESTER EVALUATIONS
Implementing feedback from midsemester evaluations to improve statistics classes, focusing on conceptual understanding, varied problem types, group work, and SPSS utilization. Dive into the basics and intricacies of One-Way ANOVA for multi-group comparisons through a step-by-step rundown of concepts and applications.

Download Presentation

Please find below an Image/Link to download the presentation.
The content on the website is provided AS IS for your information and personal use only. It may not be sold, licensed, or shared on other websites without obtaining consent from the author.If you encounter any issues during the download, it is possible that the publisher has removed the file from their server.
You are allowed to download the files provided on this website for personal or commercial use, subject to the condition that they are used lawfully. All files are the property of their respective owners.
The content on the website is provided AS IS for your information and personal use only. It may not be sold, licensed, or shared on other websites without obtaining consent from the author.
E N D
Presentation Transcript
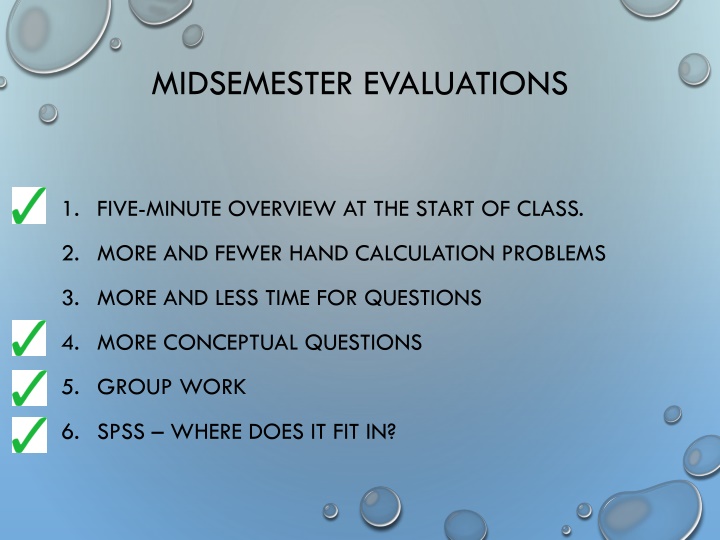
MIDSEMESTER EVALUATIONS 1. FIVE-MINUTE OVERVIEW AT THE START OF CLASS. 2. MORE AND FEWER HAND CALCULATION PROBLEMS 3. MORE AND LESS TIME FOR QUESTIONS 4. MORE CONCEPTUAL QUESTIONS 5. GROUP WORK 6. SPSS WHERE DOES IT FIT IN?
ONE-WAY ANOVA PART I
ONE-WAY ANOVA: THE RUNDOWN 1. T-test was fabulous, but limited to experiments with two or fewer groups 2. ANOVA is the next step: we use it when we have One IV Three or more groups 3. ANOVA = ANalysis Of VAriance. 4. Partition the variance into three groups Total Variability Variability due to treatment/IV (between) Variability due to CHANCE (within) 5. Test Statistic is F It s a ratio of Treatment variability divided by chance variability. ( ) N )-G 2 x2 ( )-G ( SS = ( ) N 2 T2 SS = n
ONE-WAY ANOVA: THE RUNDOWN II 6. What is old? Hypothesis testing Null and alternative hypotheses Observed and critical values Rejection region; alpha 7. What is new? SS formulas Mean Square / df F statistic / table Tukey (next time) Eta-squared (next time) ( ) 2 x x2 ( )- SS = n ( ) N )-G 2 x2 ( )-G ( SS = ( ) N 2 T2 SS = n
QUESTIONS ABOUT THE VIDEO LECTURES
Sources of variability A. The scores in the data set as a whole are relatively spread apart or relatively bunched together. B. The scores in the a treatment are relatively close to one another or relatively spread apart. C. The means are relatively similar to the Grand Mean or are relatively dissimilar from the Grand Mean Which of the above refers to: Total Variability? Between treatments? Withing treatments / error?
Sources of variability A. Generate an example of an experiment with an IV that has three levels. Then describe in words what it would mean if each of the following increased/decreased Which of the above refers to: Total Variability? Between treatments? Withing treatments / error?
HOW WOULD THIS GRAPH CHANGE IF Total variability increased/decreased? Between treatments variability increased/decreased? Within subjects variability increased/decreased? 0.06 0.05 0.04 0.03 0.02 0.01 0 101 103 105 107 109 111 113 115 117 119 121 123 125 127 129 131 133 135 137 139 141 143 145 147 149 151 153 155 157 159 161 163 165 167 169 171 69 71 73 75 77 79 81 83 85 87 89 91 93 95 97 99
0.06 0.05 0.04 SS Treatment lower Means are closer together LESS likely to reject the null 0.03 0.02 0.01 0 102 105 108 111 114 117 120 123 126 129 132 135 138 141 144 147 150 153 156 159 162 165 168 171 69 72 75 78 81 84 87 90 93 96 99 0.06 0.05 SS Treatment higher Means are further apart MORE likely to reject the null 0.04 0.03 0.02 0.01 0 102 105 108 111 114 117 120 123 126 129 132 135 138 141 144 147 150 153 156 159 162 165 168 171 69 72 75 78 81 84 87 90 93 96 99
0.06 0.05 0.04 SS Error higher Tails are longer/thicker LESS likely to reject the null 0.03 0.02 0.01 0 102 105 108 111 114 117 120 123 126 129 132 135 138 141 144 147 150 153 156 159 162 165 168 171 69 72 75 78 81 84 87 90 93 96 99 0.12 0.1 SS Error lower Tails are shorter/thinner MORE likely to reject the null 0.08 0.06 0.04 0.02 0 102 105 108 111 114 117 120 123 126 129 132 135 138 141 144 147 150 153 156 159 162 165 168 171 69 72 75 78 81 84 87 90 93 96 99 Series2 Series3 Series4
ANOVA TOTAL VARIABILITY ( n ) 2 ( ) N 2 x x2 ( )-G x2 ( )- SS = SS = M1 M2 M3 MG
ANOVA TREATMENT VARIABILITY ( n ) ( )-G ( ) N 2 2 T2 x SS = x2 ( )- n SS = M1 M2 M3 MG
ANOVA ERROR VARIABILITY ( n ) 2 x x2 ( )- SS = M1 M2 M3 MG
ANOVA: TOTAL = TREATMENT + ERROR Total Total Treatment Error Error Treatment M1 M2 M3 MG
Mood and memory Does mood effects memory. The subjects in an experiment recalled a list of words after listening to either happy music, sad music, or neutral music. There were 12 subjects in each condition. The data appear in the table below. Positive Neutral Negative 8.4 6.2 7.5 1. What is the IV? What is the DV? 2. How many factor(s) are in the experiment? 3. How many levels does the factor have? 4. What is the null hypothesis for this experiment? 5. What is the alternative hypothesis for the experiment? 6. Identify a source of treatment variability? 7. Identify one source of chance variability. 8. What is critical value for F? 9. Interpret the data if Tukey s HSD = 1.2.
Group Size and Conformity You are interested in the classic conformity studies conducted by Asch. You want to replicate findings that group size matters. You randomly assign participants to one of three conditions: 3 person, 4 person, or 5 person groups. You then conduct the classic Asch experiment and measure the number of times the participant conforms over 25 trials. Does your study suggest that group size affects the likelihood of conformity? Alpha =.05
Formula Sheet: One-Way ANOVA Step 1: One- vs. Two-tailed Test Step 2: Determine Ho and Ha Step 3: Critical value for alpha ???????= ?2 ?2 ???????= ?2 ?2 ? ?2 Step 4: Calculate ?2 ????= ? ? ? SST; SSB; SSE ????= ? 1 ??????? = ? ? ???????= ? 1 MSB; MSE ????=???? ???????=??????? ???? ??????? ???? ??????? F ratio ? = Step 5: Decision regarding the null Step 6: Tukey test (if necessary) ???????? ????? ? ??? = ? Step 7: Interpret the the results
Group Size and Conformity You are interested in the classic conformity studies conducted by Asch. You want to replicate findings that group size matters. You randomly assign participants to one of three conditions: 3 person, 4 person, or 5 person groups. You then conduct the classic Asch experiment and measure the number of times the participant conforms over 25 trials. Does your study suggest that group size affects the likelihood of conformity? Alpha =.05 3 Person 4 Person 10, 11, 14, 17 16, 16, 19, 21 5 Person 22, 24, 25, 21 What s the IV? What s the DV?
Group Size and Conformity 3 Person 4 Person 5 Person x2 100 121 196 289 x2 256 256 361 441 x2 484 576 625 441 x x x 10 11 14 17 16 16 19 21 22 24 25 21 (x2) 706 (x2) 1314 (x2) 2126 T3p 52 T4p 72 T5p 92 Ho? Ha? SST; SSB; SSE MSB; MSE F ratio Reject the null? Interpret? Post hoc
Group Size and Conformity 3 Person 4 Person x2 x 10 100 16 11 121 16 14 196 19 17 289 21 5 Person x2 256 256 361 441 x2 484 576 625 441 x x 22 24 25 21 (x2) 706 (x2) 1314 (x2) 2126 T3p 52 T4p 72 T5p 92 ( ) N 2 ( ) x G = Ho: 3p = 4p= 5p Ha: 3p 4p 5p 2 SST ( ) 2 + + 52 72 92 = + + ( 706 1314 2126 ) 12 = 4146 3888 = 258
Group Size and Conformity 3 Person 4 Person x2 x 10 100 16 11 121 16 14 196 19 17 289 21 5 Person x2 256 256 361 441 x2 484 576 625 441 x x 22 24 25 21 (x2) 706 (x2) 1314 (x2) 2126 T3p 52 T4p 72 T5p 92 2 2 T G = SSB MSB =SSB/df = 200/(3-1) = 200/2 = 100 n N 2 2 2 2 52 72 92 216 = + + 4 + 4 4 12 = + 676 1296 2116 3888 = 200
Group Size and Conformity 4 Person x2 x 100 16 121 16 196 19 289 21 3 Person 5 Person x2 256 256 361 441 x2 484 576 625 441 x x 10 11 14 17 22 24 25 21 (x2) 706 (x2) 1314 (x2) 2126 T3p 52 T4p 72 T5p 92 ( ) x 2 T = 2 SSE n MSE = SSE / df = 58 / (12-3) = 58/9 = 6.44 2 2 2 52 72 92 = + + 706 1314 2126 4 4 4 = + + 30 18 10 = 58
Group Size and Conformity F = MSB / MSE = 100/6.44 = 15.52 F critical = 4.26; reject the null Source SS df MS F Treatment 200.00 2 100.00 15.52 Error 58.00 9 6.44 Total 258.00 11 h2=SSB/SST =200/258=0.78 F (2, 9) = 15.52, p < .05
Reporting the Results A one-way ANOVA was conducted to determine if the size of the confederate group influenced conformity in the classic Asch paradigm . The ANOVA yielded a significant difference across groups: F (2, 9) = 15.52, p < .05; 2= 0.78. A Tukey test indicated that significantly more conformity was observed in the 5-person condition than the 3-person condition. The 4-person condition did not differ significantly from either of the other groups.
ANOVA in SPSS: Conformity Analyze General Linear Model Univariate
ANOVA in SPSS: Conformity 1. Slide the IV into the Fixed Factorbox. 2. Slide the DV into the Dependent Variable box. 3. Then click Options.
ANOVA in SPSS: Conformity 1. Check the boxes labeled: Descriptive statisticsand Estimates of effect size 2. Click Continue 3. Click OK
ANOVA in SPSS: Ladder data UPDATE when you have the data!!
Problem Solving A research team wants to determine how experience affects problem solving. They randomly assign their subjects into three groups: 1/3 solve an easy logic problem; 1/3 solve a difficult logic problem; 1/3 are given an unsolvable logic problem. Then, all three groups are given a new, moderately difficult logic problem to solve and the number of minutes required to solve the problem is recorded. Do the data suggest that exposure affects problem solving? Set alpha = .05. Easy Hard Unsolvable x 7 9 11 x 4 6 8 x 2 4 3
Problem Solving A research team wants to determine how experience affects problem solving. They randomly assign their subjects into three groups: 1/3 solve an easy logic problem; 1/3 solve a difficult logic problem; 1/3 are given an unsolvable logic problem. Then, all three groups are given a new, moderately difficult logic problem to solve and the number of minutes required to solve the problem is recorded. Do the data suggest that exposure affects problem solving? Set alpha = .05. Easy Hard Unsolvable x 7 9 11 x 4 6 8 x 2 4 3
SStotal A research team wants to determine how experience affects problem solving. They randomly assign their subjects into three groups: 1/3 solve an easy logic problem; 1/3 solve a difficult logic problem; 1/3 are given an unsolvable logic problem. Then, all three groups are given a new, moderately difficult logic problem to solve and the number of minutes required to solve the problem is recorded. Do the data suggest that exposure affects problem solving? Set alpha = .05. Easy Hard Unsolvable x 7 9 11 x 4 6 8 x 2 4 3 Grand mean = 6 vs.
SStotal=0 Every score would be the same and equal to the grand mean Easy Hard x x 6 6 6 6 6 6 Unsolvable x 6 6 6 ???= ?2 ?2 ? 18 + 18 + 182 9 2916 9 ???= 108 + 108 + 108 ???= 324 ???= 324 324 = ?
SSbetween A research team wants to determine how experience affects problem solving. They randomly assign their subjects into three groups: 1/3 solve an easy logic problem; 1/3 solve a difficult logic problem; 1/3 are given an unsolvable logic problem. Then, all three groups are given a new, moderately difficult logic problem to solve and the number of minutes required to solve the problem is recorded. Do the data suggest that exposure affects problem solving? Set alpha = .05. Easy Hard Unsolvable x 7 9 11 M = 9 x 4 6 8 x 2 4 3 M = 6 M = 3 Grand mean = 6 vs.
SSbetween = 0 Every treatment mean would be the same and equal to the grand mean Easy Hard Unsolvable x 3 9 6 M = 6 x 4 6 8 x 6 7 5 M = 6 M = 6 ?2 ? ?2 ???= ? 542 182 3 +182 +182 ???= 3 3 9 ???= 108 + 108 + 108 324 ???= 324-324 = 0
SSerror A research team wants to determine how experience affects problem solving. They randomly assign their subjects into three groups: 1/3 solve an easy logic problem; 1/3 solve a difficult logic problem; 1/3 are given an unsolvable logic problem. Then, all three groups are given a new, moderately difficult logic problem to solve and the number of minutes required to solve the problem is recorded. Do the data suggest that exposure affects problem solving? Set alpha = .05. Easy Hard Unsolvable x 7 9 11 M = 9 x 4 6 8 x 2 4 3 M = 6 M = 3
SSerror = 0 Every treatment mean would be the same and equal to the grand mean Easy Hard Unsolvable x 9 9 9 M = 9 x 6 6 6 x 3 3 3 M = 6 M = 3 ?2 ? ???= ?2 ???= 108 182 + 27 92 3+ 243 272 3 3 ???= 108 108 + 27 27 + 243 243 ???= 0 + 0+ 0 = 0
SSbetween A researcher wants to determine whether Exercise affects stress level. He collects data from nine people: 3 walkers, 3 joggers and 3 runners. They rate their stress from 1 (low) to 10 (high). Do the data suggest that exercise level affects stress? Set alpha = .05. Easy Hard Unsolvable x 7 8 9 M=8 x 1 2 3 x 4 5 6 M =2 M=5 Grand mean = 5