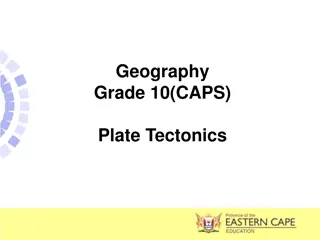
Living on the Edge: Unit 5: Convergent Plate Boundaries
Mount Rainier, an imposing volcano in the Cascades, poses significant threats like volcanic ash, pyroclastic flows, and lahars. Learn about its monitoring systems, alert levels, and seismic data to understand the risks associated with this iconic peak.

Uploaded on Feb 16, 2025 | 0 Views
Download Presentation

Please find below an Image/Link to download the presentation.
The content on the website is provided AS IS for your information and personal use only. It may not be sold, licensed, or shared on other websites without obtaining consent from the author.If you encounter any issues during the download, it is possible that the publisher has removed the file from their server.
You are allowed to download the files provided on this website for personal or commercial use, subject to the condition that they are used lawfully. All files are the property of their respective owners.
The content on the website is provided AS IS for your information and personal use only. It may not be sold, licensed, or shared on other websites without obtaining consent from the author.
E N D
Presentation Transcript
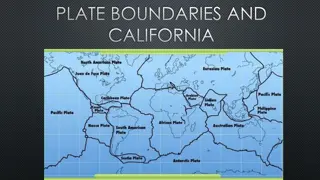
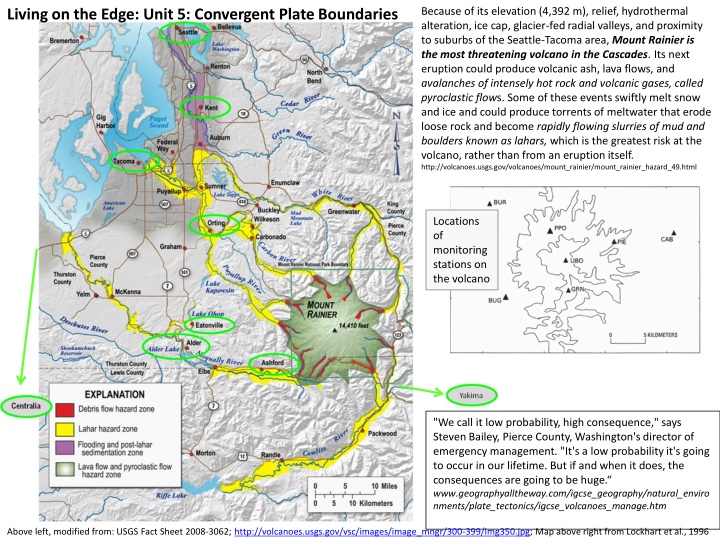
Because of its elevation (4,392 m), relief, hydrothermal alteration, ice cap, glacier-fed radial valleys, and proximity to suburbs of the Seattle-Tacoma area, Mount Rainier is the most threatening volcano in the Cascades. Its next eruption could produce volcanic ash, lava flows, and avalanches of intensely hot rock and volcanic gases, called pyroclastic flows. Some of these events swiftly melt snow and ice and could produce torrents of meltwater that erode loose rock and become rapidly flowing slurries of mud and boulders known as lahars, which is the greatest risk at the volcano, rather than from an eruption itself. http://volcanoes.usgs.gov/volcanoes/mount_rainier/mount_rainier_hazard_49.html Living on the Edge: Unit 5: Convergent Plate Boundaries Locations of monitoring stations on the volcano "We call it low probability, high consequence," says Steven Bailey, Pierce County, Washington's director of emergency management. "It's a low probability it's going to occur in our lifetime. But if and when it does, the consequences are going to be huge. www.geographyalltheway.com/igcse_geography/natural_enviro nments/plate_tectonics/igcse_volcanoes_manage.htm Above left, modified from: USGS Fact Sheet 2008-3062; http://volcanoes.usgs.gov/vsc/images/image_mngr/300-399/img350.jpg; Map above right from Lockhart et al., 1996
Living on the Edge: Unit 5: Convergent Plate Boundaries The USGS has established an alert level system to communicate the likelihood of increasing or decreasing volcanic activity. Keep these alert levels in mind as you look through the geologic activity data attached. ALERT LEVEL DESCRIPTION Volcano is in typical background, non-eruptive state or, if changing from a higher level: The activity has ceased and volcano has returned to non-eruptive background state. NORMAL Volcano is exhibiting signs of elevated unrest above known background level; or, if changing from a higher level: Volcanic activity has decreased significantly but continues to be closely monitored for possible renewed increase. ADVISORY Volcano is exhibiting heightened or escalating unrest with increased potential of eruption, timeframe uncertain; or eruption is underway but poses limited hazards. WATCH WARNING Hazardous eruption is imminent, underway, or suspected. http://volcanoes.usgs.gov/activity/alertsystem/index.php#alertlevel Note: Data included in the following handouts are from the USGS. References for specific figures and information can be obtained from your instructor.
SEISMIC DATA SET 1: THROUGH JUNE 8
SEISMIC DATA SET 1 (through June 8) SEISMOLOGY: EARTHQUAKES Seismograms of May 15 recorded at stations UBO and PIE (Z). Time marks in seconds are shown. Examples of seismic event types: A. VT = Volcano-Tectonic earthquake (associated with deep earthquakes indicating stress changes in solid rock due to injection or withdrawal of magma) and LP = Long-Period (associated with shallow injection of magma into surrounding rock) often associated with shallow magma movement, suggesting imminent eruption. B. Tremor-like episode of closely-spaced long- period events; C. Harmonic tremor (long-lasting, continuous release of seismic energy typically associated with shallow, underground movement of magma; harmonic tremor contrasts distinctly with the sudden release of seismic energy associated with slippage along a fault. D. Seismic signal from explosive eruption at station CAB (see map of stations in this data set). Time marks represent 1-min interval. Figures from: Harlow et al., 1996
SEISMIC DATA SET 1 (through June 8) SEISMOLOGY: EARTHQUAKES Seismogram of station UBO (note: this signal fades to the background 2 h after the Seismogram from station PIE recorded May 21. Time runs from top to bottom, left to right. Time marks are 60 sec apart. Date and time shown are local. Seismogram from May 21. Time marks are 60 sec apart. segment shown). Time marks are 60 sec apart. Figures from: Harlow et al., 1996
SEISMIC DATA SET 1 (through June 8) SEISMOLOGY: EARTHQUAKES May 6- 31 June 1-7 MAP VIEW MAP VIEW CROSS SECTION A side view of earthquake locations under the volcano (note location of line A-A on map above) CROSS SECTION A side view of earthquake locations under the volcano (note location of line A-A on map above) Figures from: Harlow et al., 1996
SEISMIC DATA SET 1 (through June 8) SEISMOLOGY: EARTHQUAKES RSAM data: recall that RSAM (Real-time seismic amplitude measurement) represents an average of absolute seismic amplitudes for seismic stations. RSAM does not discriminate between types of earthquakes, but all seismic signals are averaged and recorded. RSAM values (averages of 4-hour intervals) from May 10-June 8 at the PIE station. EXTENDED CAPTION: Plot of (A) the SO2 volumes from May 10-June 12; estimated from COSPEC measurements and (B) 4-hour average RSAM values from May 10-June 12. Number of seismic events per 4-hour intervals between June 1 and June 8 from (A) the entire volcano network, (B) the cluster of seismic activity 5 km northwest of the summit, and from (C) beneath the summit. Figures from: Harlow et al., 1996
, relief, hydrothermal")


")
")
")
")
")