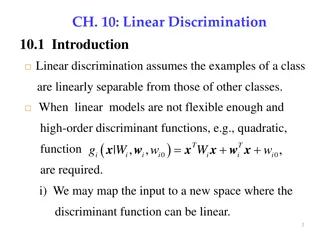
Linear Splines for Shelf Life Analysis
This content delves into the utilization of linear splines in the analysis of shelf life for a drug product stored under hybrid storage conditions. It covers the evaluation of shelf life, regulatory guidance for shelf life determination, stability monitoring, and statistical methods for assessing product attributes over time.

Download Presentation

Please find below an Image/Link to download the presentation.
The content on the website is provided AS IS for your information and personal use only. It may not be sold, licensed, or shared on other websites without obtaining consent from the author.If you encounter any issues during the download, it is possible that the publisher has removed the file from their server.
You are allowed to download the files provided on this website for personal or commercial use, subject to the condition that they are used lawfully. All files are the property of their respective owners.
The content on the website is provided AS IS for your information and personal use only. It may not be sold, licensed, or shared on other websites without obtaining consent from the author.
E N D
Presentation Transcript
Linear Splines for Shelf Life Analysis of a Drug Product Stored in Hybrid Storage Conditions Nonclinical Biostatistics Conference, 18 June 2019 John Oleynick, Jyh-Ming Shoung, Bill Pikounis Janssen Research & Development Dennis Owen Frohlich, Ph.D., Green Tree Repaint Dennis, diagnosed with ulcerative colitis, is both an artist and scholar. He focuses his studies on the Internet's role in promoting health and wellbeing.
Hybrid Storage Conditions Overview Usually, a product must be stored at a specified temperature until it is used; for large molecule products, frequently 5 C (refrigerated). Hybrid storage conditions: a product is initially stored at one temperature but at some point it is moved to storage at a different temperature; for large molecule products, frequently 5 C followed by 25 C ( controlled room temperature ). Purpose: convenience for patients, for traveling or camping or away from refrigeration 2
Shelf Life Evaluation Overview A product has one or more attributes monitored over time, such as potency, purity, levels of impurities, etc., Each has a specification that must be met (e.g potency must be between 90 and 110 %, purity must be at least 95%). Stability monitoring: units from a batch (pre-filled syringes, vials, etc.) are stored under some recommended storage conditions. At specified points in time, sample units are removed from storage and measurements of product attributes are made (e.g. T = 3 months, 6, 9, 12, 18, 24, etc.). Shelf life evaluation: show that the mean of each attribute will remain within its specifications for the duration of the shelf life of the product. 3
Hybrid Storage Example Three batches being monitored. 22 months of storage at 5 C followed by 2 months of storage at 25 C for a total of 24 months. Measurements of purity taken periodically. Show that mean remains at or above the specification of 96% over the 24 months. 4
Shelf Life Statistics Review ICH Q1E: Regulatory guidance for determining shelf life. Can use regression model to estimate stability trend over time Stability trends usually are linear but can be linear on log scale or nonlinear Can consider 3 models with a model selection strategy Will focus on model with per-batch regression lines, discuss others later Use regression model to estimate stability trend and 95% confidence interval for trend. Two-sided CI for a specification that is a range, one-sided CI for a specification that is an upper or lower limit. Show that confidence interval remains within specifications for the duration of shelf life. To support a shelf life claim, only confidence interval must remain with specifications, not all individual results (although after approval, if a batch being monitored for stability has a result outside of specifications, that batch may be recalled). 5
Stability Data for Recommended Temperature Storage Example Three batches being monitored over time. 24 months of storage at 5 C. Measurements of purity taken periodically. Show that mean remains at or above the specification of 96% over the 24 months. 6
Shelf Life Regression Analysis for Recommended Temperature Storage Example Fit linear regression model(s) Separate regression line for each batch, but pooled error term. Estimate 95% lower confidence limit for regression line Verify confidence limit is at or above specification of 96% for the duration of the shelf life. 7
Back to Hybrid Storage Example Stability trend may change at 22 months, when product moved from 5 C storage to 25 C storage. Linear model may not fit the data very well. Need to accommodate possible change of trend at 22 months. 8
Spline Mathematical definition: a function defined piecewise by polynomials. Can be used to approximate more complicated functions. Usually has continuity constraints such that adjacent pieces meet. May have additional smoothing constraints on the derivatives of the pieces. For our case we need a function defined piecewise using polynomials of order 1 such that the adjacent pieces meet Referred to as a linear spline 9
Linear Spline Bend a line at one or more points and allow the line to change direction at that point or points. These points are referred to as knots Line is broken into connected rays (at each end) and line segments (in between rays) For our case, only need spline with one knot to accommodate one change of stability trend. 10
Linear Regression Model for Shelf Life Linear regression model for shelf life, with separate regression lines for each batch: ???= ??+ ????+ ??? ??? - measurement j of batch i ?? intercept of stability trend for batch i ?? slope of stability trend for batch i ??? - time of measurement j of batch i ??? - error term for measurement j of batch i, ???~? 0,?2 11
Linear Spline with One Knot Regression Model For Shelf Life Linear spline regression model with one knot for shelf life, with separate regression lines (splines) for each batch: ???= ??+ ?????+ ??max ??? ?,0 + ??? ??? - measurement j of batch i ?? intercept of stability trend for batch i ?? slope of first segment of stability trend for batch i ??? - time of measurement j of batch i ?? slope offset for second segment of stability trend for batch i; ??+ ?? is the slope of second segment of stability trend ? knot, time of points joining first and second segments ??? - error term for measurement j of batch i, ???~? 0,?2 Parameterization from Harrell Regression Modeling Strategies, but others possible Can be extended with multiple knots, but not needed for our case. 12
Hybrid Storage Shelf Life Regression Analysis Example Fit linear spline regression model(s) Estimate 95% lower confidence limit for regression line/spline Verify confidence limit is at or above specification of 96% for the duration of the shelf life. 13
Additional ICH Q1E Shelf Life Statistics Details Can consider 3 linear regression models to estimate the stability trend(s): Separate slopes and separate intercepts for each batch Common slope for all batches but separate intercepts for each batch Common slope and common intercept for all batches Common slope models usually make it easier to keep confidence intervals within specifications Common slope usually less extreme than separate slopes Fewer parameters so more residual degrees of freedom and tighter confidence intervals Common slope models can be used if justified but are not required ICH Q1E assumes only 3 batches, which will provide low power to detect statistically significant difference between slopes and intercepts. Uses p- value cutoff of p < 0.25 to detect significant differences instead of typical p < 0.05. 14
Additional Hybrid Storage Linear Spline Regression Models Similar to ICH Q1E linear regression approach, consider 3 linear spline models: Separate slopes and separate intercepts for each batch Common slope for all batches but separate intercepts for each batch Common slope and common intercept for all batches Could have considered additional models with a common slope for one segment and separate slopes for other segment, but did not. Kept same ICH Q1E p < 0.25 cutoff for model comparisons Common slope model(s) not required for use but could make it easier to support shelf life claim in some cases 15
Linear Spline Regression Model with One Knot, Per-Batch Intercepts, Common Slope Linear spline regression model with one knot, per-batch intercepts, common slope: ???= ??+ ????+ ?max ??? ?,0 + ??? ??? - measurement j of batch i ?? intercept of stability trend for batch i ? slope of first segment of stability trend, common to all batches ??? - time of measurement j of batch i ? slope offset for second segment of stability trend, common to all batches; ? + ? is the slope of second segment of stability trend ? knot, time of points joining first and second segments ??? - error term for measurement j of batch i, ???~? 0,?2 16
Linear Spline Regression Model with One Knot, Common Intercept, Common slope Linear spline regression model with one knot, common intercept, common slope: ???= ? + ????+ ?max ??? ?,0 + ??? ??? - measurement j of batch i ? intercept, common to all batches ? slope of first segment of stability trend, common to all batches ??? - time of measurement j of batch i ? slope offset for second segment of stability trend, common to all batches; ? + ? is the slope of second segment of stability trend ? knot, time of point joining first and second segments ??? - error term for measurement j of batch i, ???~? 0,?2 17
Hybrid Storage Shelf Life Regression Analysis Example Revisited, Common Slope and Intercept For this data set, the model with per-batch intercepts and slopes did not improve the model with a common slope (p = 0.446), which in turn did not improve the model with a common slope and intercept (p = 0.409), so could use simpler model (although not necessary in this case): 18
Possible Extensions and Future Work If more than 3 batches, could use linear mixed effects model to model stability trend instead of linear regression model. If quadratic stability trend can use quadratic spline model instead of linear spline model. Usual quadratic spline model adds smoothing constraints to ensure curves are continuous across knot(s). But we don t want that because we assume the stability trend changes suddenly at the knot(s). Before conducting a hybrid storage study, may have recommended temperature storage stability data and accelerated storage condition data, which may be from the same temperature that will be used for hybrid storage. Can that data be used to model the expected results for a hybrid storage study and predict whether it will successfully support the shelf life? Impact on analysis if only one result from second storage period? 19
References F. E. Harrell Jr. Regression Modeling Strategies: With Applications to Linear Models, Logistic Regression, and Survival Analysis. Springer- Verlag, New York, 2010. Associated rms package for R (https://cran.r-project.org/package=rms) includes an lsp function which can be used to model linear splines. Although for linear splines with only one knot it may be easier to manually define the additional variable needed. 20
Q & A 21