Leveraging Child Outcomes Data for Equity Analysis
Explore how to leverage child outcomes data for equity analysis with key insights shared during the IDIO conference sessions. Discover the importance of engaging stakeholders, asking the right questions, and analyzing data to address equity issues effectively.
Download Presentation

Please find below an Image/Link to download the presentation.
The content on the website is provided AS IS for your information and personal use only. It may not be sold, licensed, or shared on other websites without obtaining consent from the author. Download presentation by click this link. If you encounter any issues during the download, it is possible that the publisher has removed the file from their server.
E N D
Presentation Transcript
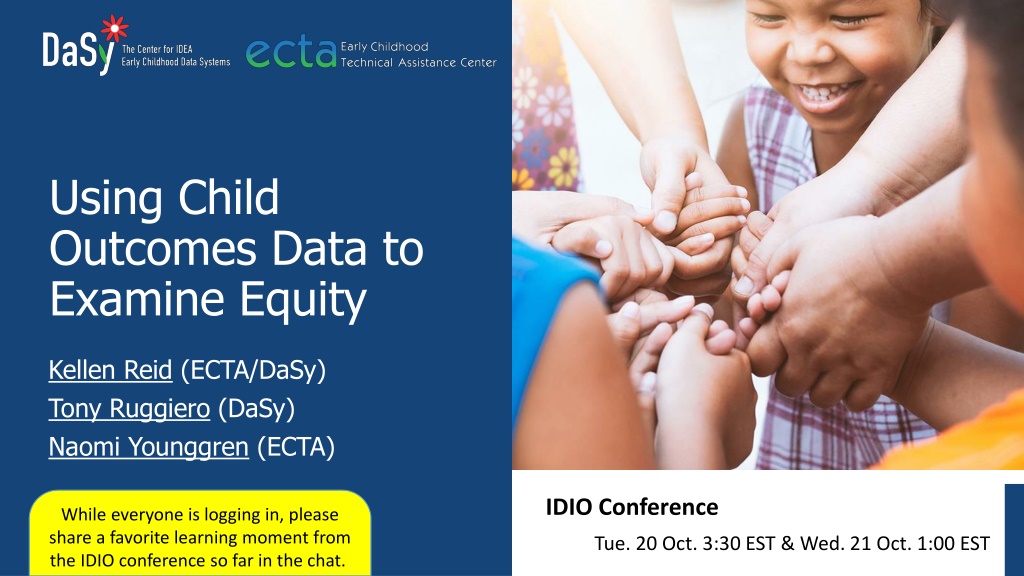
Using Child Outcomes Data to Examine Equity Kellen Reid (ECTA/DaSy) Tony Ruggiero (DaSy) Naomi Younggren (ECTA) IDIO Conference While everyone is logging in, please share a favorite learning moment from the IDIO conference so far in the chat. Tue. 20 Oct. 3:30 EST & Wed. 21 Oct. 1:00 EST
Session Overview Activities Review leveraging data to answer questions about equity Explore a hypothetical state scenario and possible equity issues Share resources Goal Increase capacity to examine child outcomes data to answer questions and inform program improvements Add resources to your toolkit 3
Leveraging data to answer questions about equity 1. Equity 2. Engaging stakeholders 3. Asking the right questions 4. Accessing & analyzing the data 5. Interpreting results & taking action 4
1. Equity Why would we do an analysis of child outcomes data and equity? 5
2. Engaging Stakeholders Hearing different perspectives is key to understanding different perspectives. Diverse stakeholder involvement is important at all points in the process... Before, during, and after asking, analyzing, and acting on the questions and data findings. 7
3. Asking The Right Questions LESS THAN GOOD QUESTIONS GOOD QUESTIONS Start with a broad topic or unclear focus Have simple yes-no answers Have no answer at all Imply a bias Have a clear focus Form from what diverse stakeholders wonder about, based on a hypothesis and a need to know Generate other questions for deeper understanding Are neutral and do not support prejudice
Good Questions Dont Imply Bias Which of these questions represents a 'good' question? a) Do black children's behavior lead to more expulsion? b) Are black children suspended more often? c) How do suspension rates differ by child characteristics? 9
Black preschool children are 3.6 times as likely to receive one or more out-of-school suspensions as white preschool children. How do suspension rates differ by child characteristics? Black children represent 19% of preschool enrollment, but 47% of preschool children being suspended. Comparatively, white children represent 41% of preschool enrollment, but 28% of preschool children being suspended. US Dept. of Ed. Office for Civil Rights https://www2.ed.gov/about/offices/list/ocr/docs/2013-14-first-look.pdf
Data Matters Black preschool children are 3.6 times as likely to receive one or more out-of-school suspensions as white preschool children. Data Matter Black children represent 19% of preschool enrollment, but 47% of preschool children being suspended. Comparatively, white children represent 41% of preschool enrollment, but 28% of preschool children being suspended. US Dept. of Ed. Office for Civil Rights
Critical Questions https://dasycenter.sri.com/downloads/DaSy_papers/DaSy_Critical_Questions_FINAL_20151023v2.pdf 12
4. Accessing & Analyzing The Data Consider internal and external data Different factors and controls Slicing and dicing Source reliability and data quality Acknowledge deeper questions that need further analysis 13
OSEP Fast Facts https://sites.ed.gov/idea/osep-fast-facts-black-or-african-american-children-with-disabilities-20/
Data In Data Out Do children with different racial/ethnic backgrounds have similar outcomes? Child Outcomes Entry Child Outcomes Exit Do child outcomes differ across local programs? Child Outcomes progress Do child outcomes differ across in home and in school services? Race Ethnicity Do programs serving children with different types of disabilities show different child outcomes? Program Name Location (in home in school) Are programs providing a greater intensity of services for children with the same type of disability showing better outcomes? Time in program Are trends over time showing gradual increases in rates of child progress and levels of achievement? Disability Language (ELL)
f D q Q F q f f q D
Exploring equity together
And now well Tell you a bit about the scenario and data you'll be exploring in your groups Conduct two separate small group break out activities (same group each time) Define the question you are exploring. Break out 1: (20 min) Examine the data together Re-group and share (10 min) Break out 2: (20 min) Examine the additional data Re-group and share (10 min)
Scenario Welcome to the great state of Wonderment in the United States of Datum Wonderment... Centrally located in the USD. Mix of large cities and rural communities with increasing diversity across the state Robust data system allowing them to examine the results of children participating in EI/ECSE and their third-grade proficiency Examined data quality for years and is confident in the quality of their data Particularly interested in knowing if the program serves some children more effectively than others Awarded a grant with the state parent education system and are excited about this cross-agency partnership and their work ahead to support families. 20
Wonderment Question Youll Explore Does the program serve some children more effectively than others?
Distribution of Wonderment Children of All Races/Ethnicities Across Progress Categories for Outcome 2 vs. National Average ( ) 100% 34% 27% 23% 15% 0% 0% 20% 24% 35% 21% 0% No New Skills (a) Not Nearer Age Expected Skills (b) Nearer Age Expected Skills (c) Attained Age Expected Skills (d) Maintained Age Expected Skills (e) NOTE: Progress categories are calculated for children enrolled in ECSE for six months or more by comparing the developmental status of each child at exit with their development status at entrance measured using age-anchored assessment tools.
Distribution of Children Identifying as White (n=3,343), African American (n=404), Hispanic (n=538), Asian (n=230), and American Indian/ Alaskan Native (n=130)in Each Progress Category (a-e) for Outcome 2 100% 36% 35% 32% 32% 31% 31% 29% 29% 28% 27% 27% 27% 26% 23% 20% 17% 14% 14% 12% 9% 0% 0% 0% 0% 0% 0% No New Skills (a) Not Nearer Age Expected Skills (b) Nearer Age Expected Skills (c) Attained Age Expected Skills (d) Maintained Age Expected Skills (e)
Percent of Children of All Races/Ethnicities Achieving 3rd Grade Proficiency from Each Progress Category for Outcome 2 vs. 3rd Grade Proficiency Statewide 100% 55% 55% (580) 42% (730) 30% (293) 28% (337) 28% (7) 0% No New Skills (a) Not Nearer Age Expected Skills (b) Nearer Age Expected Skills (c) Attained Age Expected Skills (d) Maintained Age Expected Skills (e)
Percent of White, AfricanAmerican, Hispanic, Asian, and American Indian/ Alaskan Native Children Achieving 3rd Grade Proficiency by Progress Category for Outcome 2 100% 58% (507) 55% 48% (13) 45% (575) 44% (8) 41% (30) 33% (212) 34% (25) 31% (233) 32% (55) 31% (11) 30% (20) 30% (36) 27% (4) 26% (28) 24% (40) 23% (9) 23% (32) 22% (5) 20% (24) 19% (12) 11% (4) 0% No New Skills (a) Not Nearer Age Expected Skills (b) Nearer Age Expected Skills (c) Attained Age Expected Skills (d) Maintained Age Expected Skills (e)
Small Group Break Out 1 1. What do you notice about these data? 2. What else would you like to know in follow- up to seeing these? 3. Could these differences be caused by other factors such as data quality or confounders?
Large Group Share-Back 1 How did your group interpret these analyses?
Small Group Break Out 2 Let s now look at a potentially related factor maternal education level at the time of the child s birth
Distribution of Children of All Maternal Education Levels Across Progress Categories for Outcome 2 vs. National Average ( ) 100% 34% 27% 23% 15% 0% 0% 20% 24% 35% 21% 0% No New Skills (a) Not Nearer Age Expected Skills (b) Nearer Age Expected Skills (c) Attained Age Expected Skills (d) Maintained Age Expected Skills (e)
Distribution of Children by Maternal Education Level at Childs Birth of No High School Diploma (n=496), High School Diploma/GED (n=1,310), or Greater than High School Diploma (n=2,470) Across Progress Categories for Outcome 2 100% 37% 35% 33% 30% 28% 27% 25% 21% 19% 18% 16% 11% 0% 0% 0% 0% No New Skills (a) Not Nearer Age Expected Skills (b) Nearer Age Expected Skills (c) Attained Age Expected Skills (d) Maintained Age Expected Skills (e)
Percent of Children Achieving 3rd Grade Proficiency by Maternal Education Level at Child s Birth ofNo High School Diploma, High School Diploma/GED, or Greater than High School Diploma by Progress Category for Outcome 2 100% 61% 51% 55% 39% 35% 32% 32% 31% 30% 25% 24% 23% 23% 0% 0% 0% 0% No New Skills (a) Not Nearer Age Expected Skills (b) Nearer Age Expected Skills (c) Attained Age Expected Skills (d) Maintained Age Expected Skills (e)
Small Group Break Out 2 Let s now look at a potentially related factor maternal education level at the time of the child s birth 1. What stands out to you about these figures? What differences do you see? 2. Could these differences be caused by other factors such as data quality or confounders? 3. What do these data say? 4. What additional data/analysis would you like?
Large Group Share-Back 2 What other factors should you consider when you interpret the data? Who needs to be at the table to discuss and interpret?
https://ectacenter.org/eco/assets/pdfs/AnalyzingChildOutcomesData-GuidanceTable.pdfhttps://ectacenter.org/eco/assets/pdfs/AnalyzingChildOutcomesData-GuidanceTable.pdf
Thank you Closing Visit us at http://dasycenter.org/ Follow us on Twitter: @DaSyCenter The contents of this presentation were developed under a grant from the U.S. Department of Education, #H373Z190002. The contents and resources do not necessarily represent the policy of the U.S. Department of Education, and you should not assume endorsement by the Federal Government. Project Officers: Meredith Miceli and Amy Bae.
