Kentucky FILO Financial Overview
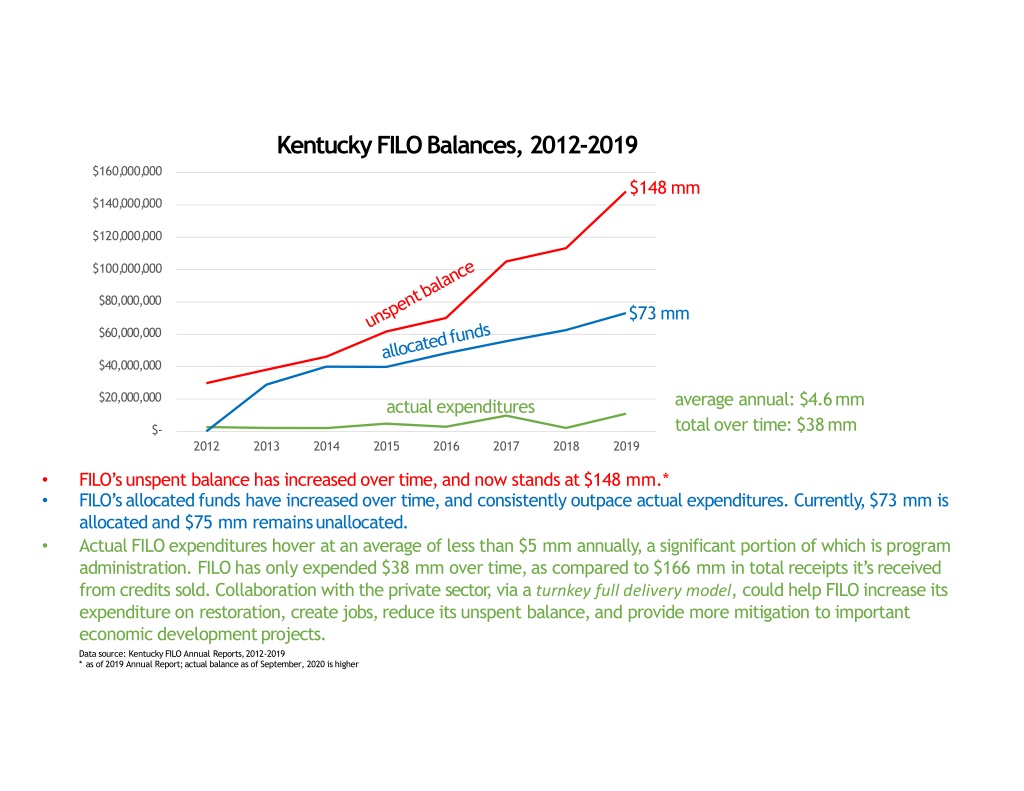
Kentucky FILO has seen an increase in unspent balances over time, currently standing at $148 million. Allocation of funds has consistently exceeded actual expenditures. Collaboration with the private sector could help increase restoration expenditure, create jobs, and reduce unspent balances. The organization has only expended $38 million over time compared to the total receipts of $166 million. The Stream Mitigation Program in Kentucky also shows outstanding liabilities in various areas.
Download Presentation

Please find below an Image/Link to download the presentation.
The content on the website is provided AS IS for your information and personal use only. It may not be sold, licensed, or shared on other websites without obtaining consent from the author. Download presentation by click this link. If you encounter any issues during the download, it is possible that the publisher has removed the file from their server.
E N D
Presentation Transcript
Kentucky FILO Balances, 2012-2019 $160,000,000 $148 mm $140,000,000 $120,000,000 $100,000,000 $80,000,000 $73 mm $60,000,000 $40,000,000 average annual: $4.6mm total over time: $38mm $20,000,000 actualexpenditures $- 2012 2013 2014 2015 2016 2017 2018 2019 FILO sunspent balance has increased over time,and now stands at$148 mm.* FILO s allocated funds have increased over time, and consistently outpace actual expenditures. Currently, $73 mm is allocated and $75 mm remainsunallocated. Actual FILO expenditures hover at an average of less than $5 mm annually, a significant portion of which is program administration. FILO has only expended $38 mm over time, as compared to $166 mm in total receipts it s received from credits sold. Collaboration with the private sector , via a turnkey full delivery model, could help FILO increase its expenditure on restoration, create jobs, reduce its unspent balance, and provide more mitigation to important economic developmentprojects. Data source: Kentucky FILO Annual Reports,2012-2019 * as of2019 Annual Report;actual balance as of September, 2020 ishigher
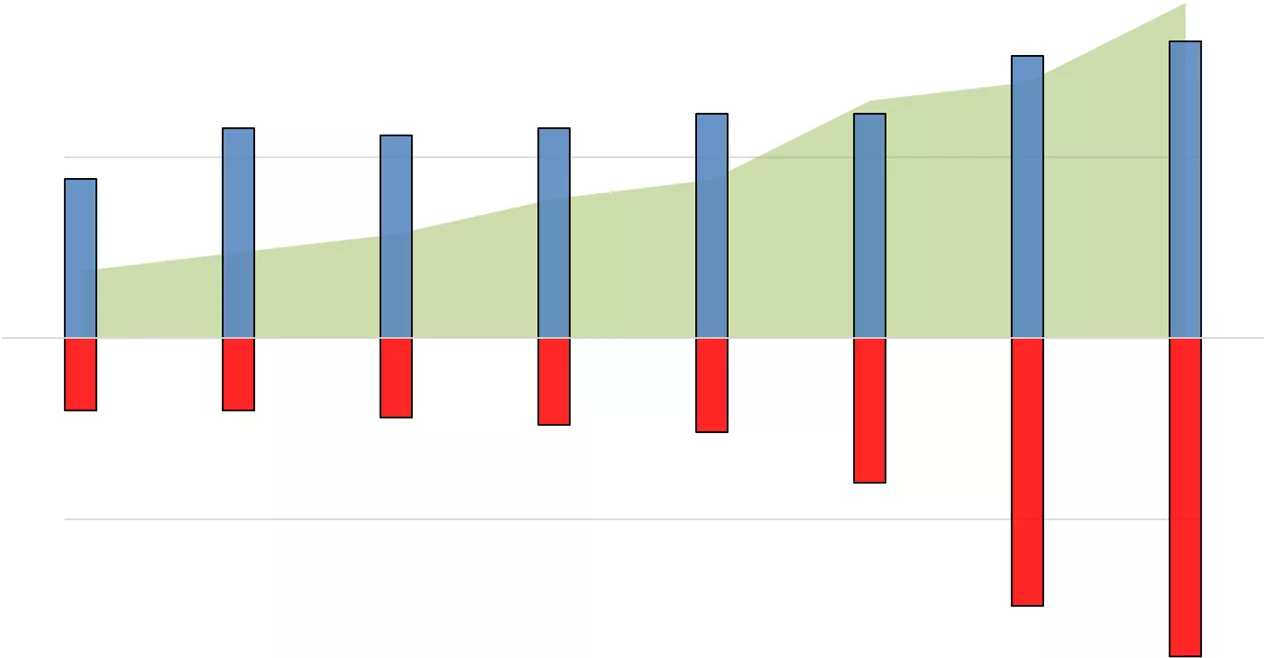
KY FILO Constructed and Terminated Projects, and FundBalance $160 50 $148.3million Millions 41 39 31 31 29 29 28 $80 25 22 TotalProjects FILOFunds 0 10 10 11 12 13 20 (80) 25 37 44 50 (160) 2012 2013 2014 2017 2018 2019 2015 2016 Fiscal Year (AnnualReport) Constructed FILOFunds* Terminated Source: KY FILO Annual Reports from2012 2019. *FILO Funds=Total Funds AdministrativeExpense ReserveFund Note: A previously constructed project failed to meet performance criteria in 2014 and was subsequentlyterminated.
Annual Change in KY FILO ProjectStatus 20 50 10 25 8 7 Annual Change inProjects 2 2 TotalProjects 1 0 0 1 1 2 7 7 10 25 17 20 50 2013 2014 2015 2017 2018 2019 2016 Fiscal Year (AnnualReport) NewlyTerminated NewlyConstructed Constructed(Total) Terminated(Total) Source: KY FILO Annual Reports from2012 2019. Note: A previously constructed project failed to meet performance criteria in 2014 and was subsequentlyterminated.
Kentucky Stream Mitigation Current OutstandingLiabilities 18,651 107,239 110,847 5,036 421 3,726 27,021 12,671 48,050 35,797 6,087 29,554 219 18,665 14,710 13,674 Big SandyRiver Area Green & Tradewater RiverArea Lower Kentucky River Area LowerLicking River Area Northern KentuckyArea Salt River Area Upper Kentucky UpperLicking River Area RiverArea FILO liabilities over 3 years old FILO liabilities under 3 yearsold Since 2011, FILOhas takenon 415,575 credits of liability and has achieved 20,825 credits of release,fora net outstanding obligation of 394,750 credits (whichis the totalof allthe bars shown above). Of these 394,750 outstanding credits,298,764 (65%) have been outstanding for 3 or more years (red bars). Each of FILO sservice areas has obligations thathave been outstanding for 3 or more years. Datasource: US Army Corps of Engineers RIBITS ledger, September 2020
