Juvenile Hall Data and Needs Assessment Report Overview
Comprehensive overview of the population profile and trends at San Francisco Juvenile Hall, highlighting disparities in detention rates based on offense types, racial and ethnic backgrounds, and residential zip codes. The report emphasizes the prevalence of technical violations, warrants, and non-violent offenses among detained youth, along with significant racial disparities despite numeric reductions in overall detention rates.
Download Presentation

Please find below an Image/Link to download the presentation.
The content on the website is provided AS IS for your information and personal use only. It may not be sold, licensed, or shared on other websites without obtaining consent from the author.If you encounter any issues during the download, it is possible that the publisher has removed the file from their server.
You are allowed to download the files provided on this website for personal or commercial use, subject to the condition that they are used lawfully. All files are the property of their respective owners.
The content on the website is provided AS IS for your information and personal use only. It may not be sold, licensed, or shared on other websites without obtaining consent from the author.
E N D
Presentation Transcript
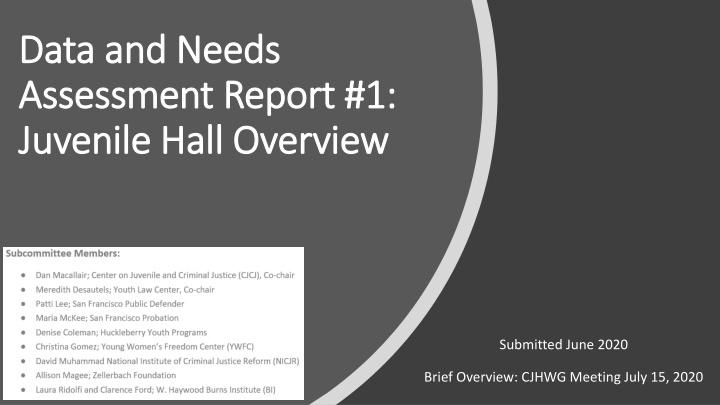
Data and Needs Data and Needs Assessment Report #1: Assessment Report #1: Juvenile Hall Overview Juvenile Hall Overview Submitted June 2020 Brief Overview: CJHWG Meeting July 15, 2020
Data and Needs Assessment Subcommittee Assignment from CJHWG Assignment Population profile over the last 6-12 months that enumerates the numbers, including but not limited to youth detained for 707b offenses, specific offenses, gender identity, race/ethnicity, age and zip code. Report Content San Francisco Juvenile Hall Population Profile San Francisco Juvenile Hall Population Profile Majority of Youth are Detained for Technical Violations, Warrants and Non-Violent Offenses Greatest Proportion of Detention for Technical Violations or Warrants are Warrant 602 Despite Numeric Reductions, Significant Racial and Ethnic Disparity Persists Population Breakdowns: Gender; Age; Residence Zip Code . . San Francisco Juvenile Hall Annual Trends Major Decrease in Incarcerated Youth Despite Significant Reductions in Detention Rates, Racial and Ethnic Disparities are Increasing Odds of Detention in Juvenile Hall, Once Referred to Probation, are Increasing Proportionally, Youth Detained for Less Serious Reasons, Has Increased Costs of Incarceration per Youth Increasing . .
Majority of Youth are Detained for Technical Violations, Warrants and Non-Violent Offenses On average, youth with warrants or accused of technical violations, misdemeanors or non-violent felonies account for 63 percent of youth detained.
Greatest Proportion of Detention for Technical Violations or Warrants are Warrant 602
Despite Numeric Reductions, Significant Racial and Ethnic Disparity Persists
Residence Zip Code Figure 6. Resident Zip Codes of Youth Booked into Juvenile Hall, 2019. Figure 6. Resident Zip Codes of Youth Booked into Juvenile Hall, 2019. In 2019: More than 1/3 of youth booked into Juvenile Hall were not San Francisco residents or had unavailable zip code information. For youth in San Francisco, top zip codes are: 94124 (Bayview /Hunter s Point) 94134 (Visitacion Valley/Portola) 94110 (Inner Mission)
