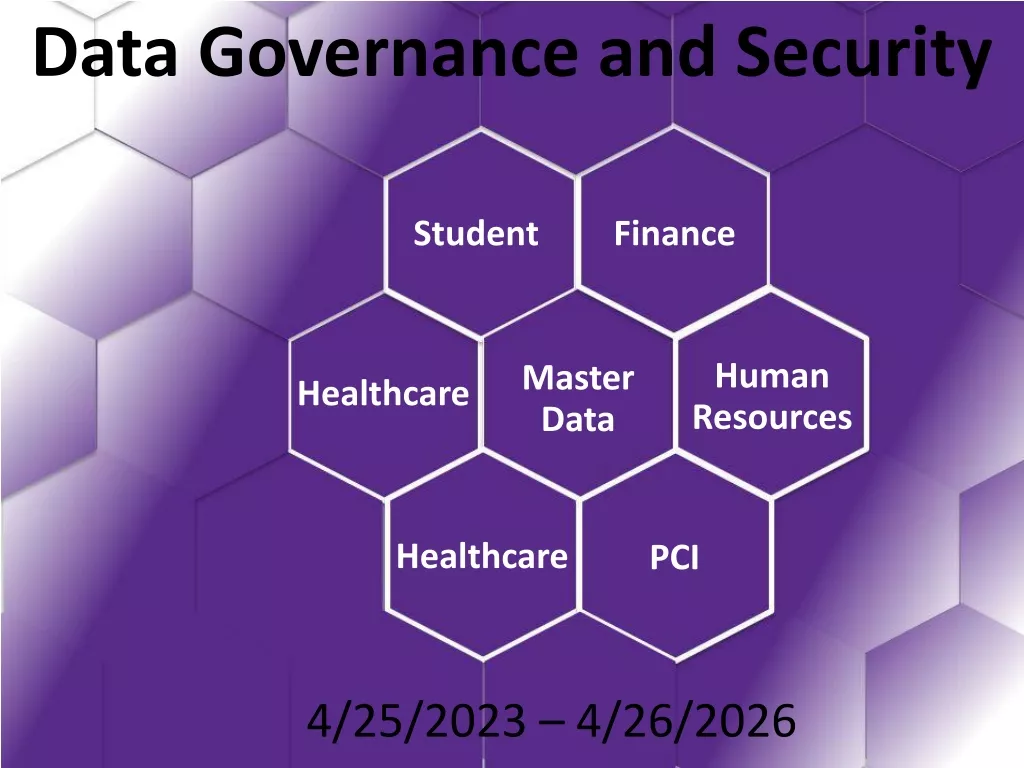
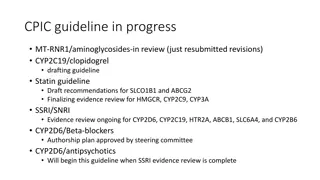
IT Governance for Effective CPIC Implementation
IT Governance plays a crucial role in supporting Capital Planning and Investment Control (CPIC) through various phases, ensuring investments deliver expected benefits. It involves evaluation, pre-selection, selection, and control to make sensible and sustainable investments. Annual operational analysis, performance measures, and investment reviews are key components. Governance teams assess CIO ratings, CPIC ratings, and utilize scorecards for decision-making. The process encompasses business case development, alternatives analysis, governance reviews, and budget formulation to achieve successful investment outcomes.
Download Presentation

Please find below an Image/Link to download the presentation.
The content on the website is provided AS IS for your information and personal use only. It may not be sold, licensed, or shared on other websites without obtaining consent from the author.If you encounter any issues during the download, it is possible that the publisher has removed the file from their server.
You are allowed to download the files provided on this website for personal or commercial use, subject to the condition that they are used lawfully. All files are the property of their respective owners.
The content on the website is provided AS IS for your information and personal use only. It may not be sold, licensed, or shared on other websites without obtaining consent from the author.
E N D
Presentation Transcript
All Party Parliamentary Group for Cycling and Walking On-line meeting 14.5.2021 How to make active travel safer Re-evaluating transport modelling and appraisal Phil Goodwin (Emeritus Professor of Transport Policy, UCL & UWE. Senior Fellow, FIT)
The best transport appraisal system in the world? BUT it was developed for large road schemes Forecast traffic growth - forecast congestion design extra road capacity calculate reduction in journey savings of time add up the total value of saved time for all vehicles assess the value And compare with the cost, to give a Benefit/Cost Ratio BCR These time savings are usually millions of savings of seconds or minutes, for 60 years, and add up to 70%- 90% of the benefit.
But national traffic forecasts usually overestimated (ever since 1989) Why? Forecasts for economic growth and population growth usually too high No account taken of social changes, eg young people use cars less than their parents https://infrastructure.planninginspectorate.gov.uk/wp-content/ipc/uploads/projects/TR010019/TR010019-001815- Campaign%20for%20Better%20Transport.pdf
AND COMPARISONS ARE PARTIAL Othercosts and benefits much smaller Alternativepolicies sidelined eg ambitious improvements for walking, public transport and cycling especially safety, health, carbon and economic effects. and sensible pricing or enforcement changes. These are more important and more real than time savings but have had marginal effects on the decisions These are very rarely compared with road schemes
Result: road spending much greater than walking, cycling, public transport (capital+revenue) (Source: slide from Transport for Quality of Life, http://www.transportforqualityoflife.com/
BUT congestion relief not as much as hoped 2. Congestion getting worse more slowly than it would otherwise is counted as a time saving 1. Induced Traffic Congestion Traffic on improved roads increased on average by 10% in the short run, 20% in the long run, by the road improvement itself Without scheme Benefit With scheme Years (Sactra 1994)
What about BCRs for sustainable transport? Source: https://uwe-repository.worktribe.com/output/985006/opportunities-for-improving-transport-and-getting-better-value-for-money-by-changing-the-allocation- of-public-expenditure-to-transport The more you spend, the less extra benefit you get. Local safety schemes, and sustainable transport give most benefit per spent.
HM Treasury Review of Project Appraisal Considerable time and effort is expended to boost the BCR that would have been better spent developing and testing the other elements of the business case including its strategic coherence, risk management and the implications of significant unquantifiable factors The BCR instead focuses on benefits that it is easy to put a monetary value on. This in turn creates an incentive for proposers to artificially boost the BCR with such benefits that are unlikely to be realised, as well as suggesting a level of certainty around the value of those benefits that is not merited by the evidence H.M. Treasury (2020) Final Report of the Review of the Green Book https://www.gov.uk/government/publications/final-report-of-the-2020-green-book-review
https://www.dropbox.com/s/d8pfw3duc2k0jpe/Transport%20Appraisal%2https://www.dropbox.com/s/d8pfw3duc2k0jpe/Transport%20Appraisal%2 0Evidence%20to%20Commons%20Transport%20Committee%20Phil%20Go odwin%20January%202021.docx?dl=0
Conclusions Transport appraisal methods are elaborate, and complicated, but don t be overawed. They are not perfect, and the imperfections are such as to make road spending more beneficial than it really is. Traffic growth is not inevitable. Health, safety, carbon, quality of life and the viability of local communities are genuinely important objectives, and they tend to favour improvements to walking, cycling and public transport. (Not forgetting equity, pricing, taxation, enforcement and regulation, which I haven t talked about today)
