Investor Presentation - Q3 FY19, February 2019

 undefined


I
N
V
E
S
T
O
R
P
R
E
S
E
N
T
A
T
I
O
N
Q
3
FY19,
February
201
9


D
i
s
c
l
a
i
m
e
r
/
I
m
p
o
r
t
a
n
t
D
i
s
c
l
o
s
u
r
e

THIS PRESENTATION (PRESENTATION)
IS
NOT AN OFFER TO
SELL ANY
SECURITIES OR
A
SOLICITATION TO
BUY ANY
SECURITIES OF NATCO PHARMA LIMITED OR
ITS
SUBSIDIARIES OR JOINT
VENTURES (TOGETHER, THE
“COMPANY”).
The
material that
follows
is a Presentation of general background information about the
Company’s
activities as at the date
of
the Presentation
or as otherwise
indicated. It is
information
given in
summary form
and does
not
purport
to
be
complete
and
it cannot
be guaranteed
that such information
is
true
and
accurate.
This
Presentation
has been prepared
by and is
the sole
responsibility
of the
Company.
By accessing this Presentation,
you are agreeing
to
be bound by
the
trading
restrictions. It
is
for
general
information purposes
only
and
should
not
be
considered
as
a
recommendation
that
any
investor
should
subscribe
/ purchase
the
Company
shares.
This
Presentation includes statements that are, or may be deemed to be, “forward-looking statements”.
These
forward-looking statements can
be
identified
by
the use of forward-
looking
terminology,
including the terms
“believes”,
“estimates”, “anticipates”, “projects”,
“expects”,
“intends”,
“may”,
“will”,
“seeks” or “should” or, in each case, their
negative
or other
variations or
comparable
terminology, or by
discussions of
strategy,
plans, aims, objectives, goals, future
events or
intentions.
These forward-looking
statements include
all
matters
that
are
not historical facts.
They appear in a
number of places throughout this Presentation
and
include statements
regarding
the
Company’s
intentions, beliefs or current
expectations
concerning,
amongst
other
things,
its results
or
operations,
financial
condition,
liquidity,
prospects,
growth,
strategies
and
the
industry
in
which
the
Company
operates.
By
their
nature, forward-looking statements
involve
risks
and
uncertainties because they
relate
to
events and depend on
circumstances
that may
or
may not occur
in
the future.
Forward-looking
statements
are
not
guarantees
of future performance including those relating to
general
business
plans and
strategy
of the
Company,
its future outlook
and growth
prospects,
and
future
developments in
its
businesses and
its competitive
and regulatory environment. No
representation,
warranty
or undertaking, express or
implied,
is
made
or
assurance
given
that such statements,
views,
projections
or
forecasts, if
any, are
correct
or
that the
objectives
of the
Company
will be achieved. There are
some important factors that
could cause material differences to
Company’s
actual results.
These
include
(i)
our ability
to successfully implement
our
strategy
(ii) our growth and expansion plans (iii)
changes
in
regulatory
norms applicable to the Company
(iv) technological
changes
(v)
investment
and
business income
(vi)
cash flow projections etc.
(vii) exposure
to market
as well as other
risks.
The Company, as
such, makes
no
representation
or warranty, express or
implied,
as
to,
and does
not accept
any responsibility or liability with respect
to, the fairness,
accuracy,
completeness
or
correctness of
any
information
or opinions
contained
herein. The
information contained
in
this Presentation, unless
otherwise
specified
is only
current
as
of the
date
of
this Presentation.
The
Company assumes
no responsibility
to publicly amend, modify
or revise any forward
looking statements,
on
the basis of
any
subsequent
development,
information
or
events,
or
otherwise.
Unless
otherwise
stated
in
this
Presentation,
the
information
contained
herein
is
based
on
management
information
and
estimates.
Any
opinions expressed in
this presentation
are
subject to change
without
notice.
The
presentation should not
be
construed
as legal, tax,
investment
or other advice. None
of the
Company
or any
of its affiliates,
advisers or representatives
accepts
any liability whatsoever
for
any
loss
howsoever
arising from
any
information presented
or
contained
in
this
presentation. The
information contained
in
this presentation
has
not
been independently verified.
Furthermore,
no
person
is
authorized
to
give any
information
or
make
any
representation which is
not contained in,
or
is inconsistent
with,
this presentation. Any such
extraneous or
inconsistent
information
or
representation, if
given or
made, should not
be
relied upon as having been authorized by or on behalf
of the
Company.
Further, past performance
is
not necessarily
indicative
of future
results.
This
document
is
just
a
Presentation for information purposes
and private
circulation
only and
is not intended to be a “prospectus” or “offer document” or a
“private
placement offer
letter” (as defined or referred to, as the case may be, under the
Companies
Act, 2013). It is clarified that this
Presentation
is
not
intended
to
be a
document offering for subscription
or
sale of
any
securities
or inviting
offers from the
Indian public
(including
any
section thereof)
or
from persons residing
in any other
jurisdiction including the United States for the
subscription to
or
sale of
any
securities including the
equity
shares of the Company
or any
of its subsidiaries.
No
part of it should form the basis of
or be relied upon in
connection
with
any investment decision or any
contract
or
commitment to purchase
or
subscribe for
any
securities.
None of
the
Company’s
securities
may be offered or sold in the United States
without
registration
under
the
U.S.
Securities
Act
of
1933,
as
amended,
except
pursuant
to
an
exemption
from
registration
there
from.
This
document
has
not
been and will
not
be reviewed or approved by a regulatory
authority
in India or by any
stock
exchange
in
India.
This presentation is
confidential
and
this
presentation
or any
part thereof should not
be
used
or relied upon by any other
party
or
for
any other
purpose
and
should not
be
copied, reproduced,
recirculated,
redistributed,
published
in any
media,
website or otherwise, in any
form
or
manner,
in
part
or as a whole, without
the
express
consent
in
writing
of the
Company.
Any
unauthorized
use, disclosure
or
public dissemination
of information contained
herein is prohibited. The
distribution of this presentation
in
certain
jurisdictions
may
be
restricted
by law. Accordingly, any
persons
in
possession
of
the
aforesaid
should
inform
themselves
about
and
observe
any
such
restrictions.
2
N
a
t
c
o
P
h
a
r
m
a
a
t
a
G
l
a
n
c
e
Vertically integrated pharmaceutical company with presence across geographies - India, US and ROW
Vertically integrated pharmaceutical company with presence across geographies - India, US and ROW
Strong brand position
Strong brand position
in the domestic Oncology and Hepatitis – C(‘Hep-C’) segments
in the domestic Oncology and Hepatitis – C(‘Hep-C’) segments
- Portfolio of brands catering to various oncology diseases including breast, bone, lung and ovarian cancer
- Portfolio of brands catering to various oncology diseases including breast, bone, lung and ovarian cancer
- Launched the generic version of Gilead’s Sovaldi (Sofosbuvir) and its combinations for the treatment of Hep-C in India
- Launched the generic version of Gilead’s Sovaldi (Sofosbuvir) and its combinations for the treatment of Hep-C in India
Focused on
Focused on
complex generics for the US Markets
complex generics for the US Markets
with niche Para IV and Para III filings
with niche Para IV and Para III filings
Strong focus on R&D
Strong focus on R&D
with over 400 employees dedicated to R&D
with over 400 employees dedicated to R&D
(3)
Total revenues
Total revenues
(1)
of INR 22,424 mn for the financial year ended 31
of INR 22,424 mn for the financial year ended 31
st
st
March 2018
March 2018
Listed on the BSE and NSE with a market capitalization
Listed on the BSE and NSE with a market capitalization
(2)
of
USD2.14bn
Incorporated in 1981 and headquartered in Hyderabad with over 4,830 employees across all locations
Incorporated in 1981 and headquartered in Hyderabad with over 4,830 employees across all locations
(3)
Expanding into Niche Agrichemical business, leveraging on its Chemistry and manufacturing skills
Expanding into Niche Agrichemical business, leveraging on its Chemistry and manufacturing skills
3
(1)
Represents consolidated
revenue
from operations
(gross)
(2)
Market
capitalization as of
31 March 2018,
using INR /
USD exchange
rate of
65.04
(3)
As
of
March
31,
2018
FY2014
and FY2015
numbers
have
been prepared
under
IGAAP,
whereas
FY2016, FY2017
and FY2018
numbers
have
been prepared
under
Ind
AS
(1)
Represents
consolidated
gross
revenue
and
includes
other
income
(2)
Represents
PAT after minority
interest
(3)
Source:
BSE,
as of
December
3
1
2018
T
r
a
c
k
R
e
c
o
r
d
o
f
C
o
n
s
i
s
t
e
n
t
G
r
o
w
t
h
4
1,960
2,131
2,823
6,973
9,688
FY2
0
14
FY2
0
15
FY2
0
16
FY2
0
17
FY2
0
18
1,027
1,346
1,571
6
,9
62
4,860
FY2
0
14
FY2
0
15
FY2
0
16
FY2
0
17
FY2
0
18
26%
25%
26%
34%
14%
16%
14%
23%
#
M
argin
s
E
B
I
T
D
A
INRmn
P
A
T
(
2
)
INRm
n
O
w
n
e
r
s
h
i
p
S
t
r
u
c
t
u
r
e
(
3
)
N
a
t
c
o
P
h
a
r
m
a
’
s
S
t
o
c
k
P
e
r
f
o
r
m
a
n
c
e
o
v
e
r
t
h
e
p
a
s
t
4
a
n
d
h
a
l
f
y
e
a
r
s
(
3
)
Promoters,
48.
42
%
Public,
51.
58
%
43%
31%
K
e
y
B
u
s
i
n
e
s
s
S
e
g
m
e
n
t
s
5
Strategically important
division
Vertical
integration for
its
Finished
Dosage
Formulation
(‘FDF’)
portfolio
Filed
42 DMFs
in the US
with
niche
products under
development
Exports focused on Europe
and
emerging
markets
F
o
r
m
u
l
a
t
i
o
n
s
Operations
in
Brazil, Canada,
Singapore and
Australia
Selective
contract
manufacturing
business
and other operating
income
O
t
h
e
r
s
A
P
I
(
D
o
m
e
s
t
i
c
&
E
x
p
o
r
t
s
)
O
v
e
r
v
i
e
w
F
Y
1
8
R
e
v
e
n
u
e
(
I
N
R
m
n
)
2
,
8
5
4
1
,
9
5
0
F
Y
1
8
R
e
v
e
n
u
e
C
o
n
t
r
i
b
u
t
i
o
n
G
r
o
w
t
h
F
Y
1
8
o
v
e
r
F
Y
1
7
I
n
t
e
r
n
a
t
i
o
n
a
l
Focused on complex
generics
for
the
US
Front end partnerships with
leading
global generic
pharma
companies
Niche
Para
IV
and
Para III filings
Emerging
presence
in Asia,
Europe and developing
markets
1
0
,
4
1
8
4
7
%
2
5
%
5
5
%
1
0
%
Note: All
numbers are
Gross
Revenue
All data as of
March
31,
2018
*
Includes third party
sales
Strong
brand
position in the
domestic
oncology and
Hepatitis-
C
segments
Recent foray
into the
Cardiology
and Diabetology
segments
Specialist sales
force of over 350
personnel and over 400
distributors
Fall in FY18
revenue due
to
decline
in
HepC
market
size.
Expect growth with target
launch
of
8-10
molecules
per
year
D
o
m
e
s
t
i
c
7
,
2
0
2
*
-
1
8
%
3
2
%
1
3
%
9
%
Pipeline of niche and complex generics products in
US
29 approved
ANDAs
(2)
16 Para IVs
yet
to be launched
(2)
U
S
M
a
r
k
e
t
-
F
o
c
u
s
o
n
C
o
m
p
l
e
x
G
e
n
e
r
i
c
s
6
K
e
y
P
r
o
d
u
c
t
s
i
n
P
i
p
e
l
i
n
e
(1)
Launch
conditional
on approval
(2)
As
of
March
31, 2018.
Approval
received either by Natco or its
marketing
partner
US
FDF
product portfolio is predominantly focused on high-barrier-to-entry products that are typically characterised by one or more of
the
following:
-
Intricate
chemistry
-
Challenging delivery
mechanism
-
Difficult or complex manufacturing
process
-
May face complex legal and regulatory
challenges
L
o
w
R
i
s
k
B
u
s
i
n
e
s
s
M
o
d
e
l
t
h
r
o
u
g
h
P
a
r
t
n
e
r
s
h
i
p
s
w
i
t
h
G
l
o
b
a
l
P
h
a
r
m
a
c
e
u
t
i
c
a
l
P
l
a
y
e
r
s
Adopted and successfully implemented
partnership
strategy
for
international formulation
products
─
Has product specific partnerships
with global
generic
players
at different stages of a potential ANDA filing
─
Low risk business
model:
Marketing partner
typically
responsible
for
the
litigation
and regulatory process to secure the
ANDA
approval
Multi-site
approvals
Multi-sourcing
arrangements
─
Profit sharing arrangements
with
the front end
partners.
Brand Molecule Dosage Form Therapautic Segment
S
t
r
o
n
g
G
r
o
w
t
h
i
n
D
o
m
e
s
t
i
c
F
o
r
m
u
l
a
t
i
o
n
s
B
u
s
i
n
e
s
s
7
D
o
m
e
s
t
i
c
F
o
r
m
u
l
a
t
i
o
n
S
a
l
e
s
(
1
)
:
M
a
r
k
e
t
L
e
a
d
i
n
g
G
r
o
w
t
h
1,983*
2,516*
6,342*
8,810*
7,202*
F
Y
2
0
1
4
F
Y
2
0
1
5
F
Y
2
0
1
6
F
Y
2
0
1
7
F
Y
2
0
1
8
S
t
r
o
n
g
p
o
s
i
t
i
o
n
i
n
O
n
c
o
l
o
g
y
a
n
d
H
e
p
a
t
i
t
i
s
-
C
d
o
m
a
i
n
s
B
r
a
n
d
s
i
n
e
x
c
e
s
s
o
f
I
N
R
1
0
0
m
n
+
s
a
l
e
s
i
n
O
n
c
o
l
o
g
y
s
e
g
m
e
n
t
6
INRm
n
FY2014
and
FY2015
numbers
have
been
prepared
under
IGAAP,
whereas
FY2016,
FY2017
and
FY2018
numbers
have
been
prepared
under
Ind
AS
(1)
Represents gross
revenue
*
Includes third party
sales
D
o
m
e
s
t
i
c
P
r
o
d
u
c
t
L
a
u
n
c
h
e
s
F
Y
1
9
–
U
P
T
O
Q
3
B
r
a
n
d
s
o
c
c
u
p
y
t
h
e
#
1
p
o
s
i
t
i
o
n
i
n
H
e
p
-
C
s
e
g
m
e
n
t
4
S
a
l
e
s
f
o
r
c
e
i
n
I
n
d
i
a
a
c
r
o
s
s
O
n
c
o
l
o
g
y
,
G
a
s
t
r
o
H
e
p
a
t
o
l
o
g
y
,
C
a
r
d
i
o
l
o
g
y
a
n
d
D
i
a
b
e
t
o
l
o
g
y
3
5
0
+
Denopsy
Teriflunomide
Tablets
Speciality Pharma
Posaconazole
Posan
a
t
Injection
Speciality Pharma
F
Y
1
7
-
1
8
In FY 17-18, Natco had the following product launches
In the Oncology segment – Alphalan, Carfilnat and Pomalid
In the Speciality Pharma segment – Tafnat and Velpanat
In the Cardiology segment – Arganat and Dabigat
S
t
r
o
n
g
M
a
r
k
e
t
P
o
s
i
t
i
o
n
i
n
D
o
m
e
s
t
i
c
O
n
c
o
l
o
g
y
S
e
g
m
e
n
t
8
Entered the segment
with
launch of generic version of Imatinib in
2003
Portfolio of
well recognized
brands – 6 brands
with
INR 100mn+ sales in
the oncology
segment
P
r
o
g
r
e
s
s
i
v
e
l
y
w
i
d
e
n
e
d
i
t
s
o
n
c
o
l
o
g
y
p
r
o
d
u
c
t
r
a
n
g
e
f
r
o
m
6
i
n
2
0
0
3
-
0
4
t
o
3
0
(
1
)
Sales
and marketing of the product
is
supported by approximately 70
sales representatives
and
strategically located logistics network of
distributors
O
n
c
o
l
o
g
y
P
o
r
t
f
o
l
i
o
FY2014
and
FY2015
numbers
have
been
prepared
under
IGAAP,
whereas
FY2016,
FY2017
and
FY2018
numbers
have
been
prepared
under
Ind
AS
(1)
As on 31 March,
2018
(2)
Source:
Company
O
n
c
o
l
o
g
y
R
e
v
e
n
u
e
–
G
r
o
s
s
(
I
N
R
m
n
)
O
n
c
o
l
o
g
y
D
i
v
i
s
i
o
n
O
v
e
r
v
i
e
w
H
e
m
a
t
o
l
o
g
y
S
o
l
i
d
T
u
m
o
r
s
1
3
#
o
f
A
c
t
i
v
e
B
r
a
n
d
s
(
1
)
1
7
I
N
R
1
0
0
m
n
+
B
r
a
n
d
s
(
F
Y
1
8
)
(
2
)
(Erlonat)
(
G
ef
ti
nat)
(
S
ora
f
e
n
a
t
)
(
V
e
e
n
a
t)
(L
e
n
a
li
d
)
(
B
or
t
e
n
at)
1,572
1,947
2,526
3,224
3,335
FY2
0
14
FY2
0
15
FY2
0
16
FY2
0
17
FY2
0
18
P
h
a
r
m
a
S
p
e
c
i
a
l
t
i
e
s
9
E
x
p
a
n
d
i
n
g
I
n
t
o
E
m
e
r
g
i
n
g
M
a
r
k
e
t
s
O
f
A
s
i
a
A
n
d
A
f
r
i
c
a
(1)
Including
India
G
a
s
t
r
o
H
e
p
a
t
o
l
o
g
y
–
L
e
a
d
i
n
g
M
a
r
k
e
t
P
o
s
i
t
i
o
n
i
n
H
e
p
-
C
P
o
r
t
f
o
l
i
o
E
x
t
e
n
d
i
n
g
t
h
e
H
e
p
-
C
F
r
a
n
c
h
i
s
e
Launched generic Sofosbuvir and its combinations
for
the treatment of Hep-C in India & Nepal under its
brand
H
e
p
c
i
n
a
t
&
H
e
p
c
i
n
a
t
L
P
Non-exclusive licensing agreement
with
Gilead Sciences
for
105
countries including
India
L
a
u
n
c
h
e
d
g
e
n
e
r
i
c
D
a
c
l
a
t
a
s
v
i
r
i
n
I
n
d
i
a
u
n
d
e
r
i
t
s
b
r
a
n
d
N
a
t
d
a
c
a
n
d
a
n
o
r
a
l
f
i
x
e
d
-
d
o
s
e
c
o
m
b
i
n
a
t
i
o
n
o
f
S
o
f
o
s
b
u
v
i
r
a
n
d
V
e
l
a
p
a
t
a
s
v
i
r
u
n
d
e
r
i
t
s
b
r
a
n
d
V
e
l
p
a
n
a
t
Market
leading positions
across the Hep-C class of drugs
in
India
Sales
and
marketing
of the product is supported by approximately 120 sales
representatives
L
a
u
n
c
h
e
d
H
e
p
c
i
n
a
t
P
l
u
s
,
a
g
e
n
e
r
i
c
f
i
x
e
d
d
o
s
e
c
o
m
b
i
n
a
t
i
o
n
o
f
S
o
f
o
s
b
u
v
i
r
a
n
d
D
a
c
l
a
t
a
s
v
i
r
f
o
r
t
h
e
f
i
r
s
t
t
i
m
e
i
n
I
n
d
i
a
Foraying
into RoW
markets
Import Permits & Approvals
Received
Access
via
Agreement
with
Gilead
I
m
p
o
r
t
p
e
r
m
i
t
s
/
a
p
p
r
o
v
a
l
s
f
o
r
H
e
p
-
C
r
e
l
a
t
e
d
d
r
u
g
r
e
c
e
i
v
e
d
i
n
1
4
c
o
u
n
t
r
i
e
s
(
1
)
E
m
e
r
g
i
n
g
p
o
r
t
f
o
l
i
o
o
f
H
e
p
B
L
a
u
n
c
h
e
d
T
e
n
o
f
o
v
i
r
A
l
a
f
e
n
a
m
i
d
e
t
a
b
l
e
t
s
u
n
d
e
r
i
t
s
b
r
a
n
d
T
a
f
n
a
t
a
s
a
n
e
x
t
e
n
s
i
o
n
t
o
e
x
i
s
t
i
n
g
H
e
p
B
p
o
r
t
f
o
l
i
o
o
f
T
e
n
o
f
o
v
i
r
(
T
e
r
a
v
i
r
)
&
E
n
t
e
c
a
v
i
r
(
X
-
V
i
r
)
t
a
b
l
e
t
s
E
x
p
a
n
d
i
n
g
D
o
m
e
s
t
i
c
P
r
e
s
e
n
c
e
w
i
t
h
C
n
D
D
i
v
i
s
i
o
n
1
0
C
a
r
d
i
o
l
o
g
y
a
n
d
D
i
a
b
e
t
o
l
o
g
y
Launched Cardiology and Diabetology (CnD) division in early
2017
First to launch Argatroban injection and Dabigatran in India
for
treatment of patients
with
thrombosis
syndrome
Focus
will
be on niche molecules
with
high barriers to
entry
E
x
p
a
n
d
i
n
g
R
o
W
P
r
e
s
e
n
c
e
1
1
F
o
c
u
s
o
n
C
a
n
a
d
a
,
B
r
a
z
i
l
a
n
d
o
t
h
e
r
R
o
W
m
a
r
k
e
t
s
E
u
r
o
p
e
Distribution arrangements
with
our
business partner to sell our products
in
Eastern Europe, UK and
Germany
H
e
p
-
C
d
r
i
v
e
n
m
a
r
k
e
t
s
Received approvals and import permits
for
14
countries
(1)
(1) Including
India
Note: All data as of
March
31,
2018
Launched Oseltamivir (generic
drug
of
Tamiflu) (30mg, 45mg,
75mg)
13
approvals
Successful listings in
major
provinces
and retail chains
C
a
n
a
d
a
Commenced
operations
in
2011
Filed multiple
oncology
products
Received
1
st
product approval
for
Letrozole
B
r
a
z
i
l
Presence in Singapore (8 approvals)
and
Australia
A
s
i
a
P
a
c
i
f
i
c
(
I
n
c
l
u
d
i
n
g
A
u
s
t
r
a
l
i
a
)
I
n
-
H
o
u
s
e
A
P
I
D
e
v
e
l
o
p
m
e
n
t
w
i
t
h
V
e
r
t
i
c
a
l
I
n
t
e
g
r
a
t
i
o
n
f
o
r
K
e
y
F
o
r
m
u
l
a
t
i
o
n
P
r
o
d
u
c
t
s
Strategically important business –
develops
APIs primarily
for
captive
consumption of its FDF portfolio as
well
as third party
sales
Portfolio of 42 US
DMFs
(1)
with with
niche products under
development
Focuses on complex molecules in oncology and CNS
segments
−
Other therapeutic areas of
focus
includes Anti-asthmatic, Anti-
depressant, Anti-migraine, Anti-osteoporosis and G I
Disorders
Exports are focused on the US, EU, Canada, Latin America and South-
East
Asia
Vertical integration
for
several APIs a
key
competitive
advantage
A
P
I
S
t
r
e
n
g
t
h
s
Complex multi-step
synthesis
&
scale-up
Semi-synthetic fusion technologies
−
Fermentation / Biotech /
Synthetic
/ Separation technologies
Containment / High potency
APIs
Peptide
(Solid
phase)
pharmaceuticals
1
2
E
x
p
a
n
s
i
o
n
p
l
a
n
s
t
o
a
u
g
m
e
n
t
A
P
I
m
a
n
u
f
a
c
t
u
r
i
n
g
c
a
p
a
c
i
t
y
(1)
As
of
March
31,
2018
R
e
s
e
a
r
c
h
&
D
e
v
e
l
o
p
m
e
n
t
C
a
p
a
b
i
l
i
t
i
e
s
1
3
2
9
A
N
D
A
s
A
p
p
r
o
v
e
d
(
2
)
4
2
U
S
D
M
F
s
F
i
l
e
d
(
2
)
S
e
v
e
r
a
l
I
n
t
e
r
n
a
t
i
o
n
a
l
a
n
d
I
n
d
i
a
n
p
a
t
e
n
t
s
f
i
l
e
d
a
n
d
g
r
a
n
t
e
d
FY2014 and FY2015 numbers have been prepared under IGAAP, whereas FY2016 and
FY2017
numbers
have been prepared under
Ind
AS
(1)
As
of
March
31,
2018.
(2)
As
of
March
31,
2018. Approval
received either by Natco or its
marketing
partner
#
%
of standalone
revenues
O
v
e
r
3
5
R
&
D
l
a
b
o
r
a
t
o
r
i
e
s
i
n
2
r
e
s
e
a
r
c
h
f
a
c
i
l
i
t
i
e
s
Note:
Rounded
off to the nearest
decimal
Note: Rounded off to the nearest
decimal
1
6
P
a
r
a
I
V
s
t
o
b
e
L
a
u
n
c
h
e
d
(
2
)
39%
39%
4%
5%
3%
10%
Process
De
v
el
o
p
m
e
n
t
Analytical
De
v
el
o
p
m
e
n
t
DQA
Biotech
&
Fermentation
Nanoformulations
Discovery
11%
59%
30%
PhD
M
a
s
t
e
rs
Others
C
o
m
m
i
t
m
e
n
t
t
o
M
a
n
u
f
a
c
t
u
r
i
n
g
E
x
c
e
l
l
e
n
c
e
w
i
t
h
a
C
u
l
t
u
r
e
o
f
Q
u
a
l
i
t
y
a
n
d
C
o
m
p
l
i
a
n
c
e
Under
development
E
x
p
e
r
i
e
n
c
e
d
M
a
n
a
g
e
m
e
n
t
1
5
D
r
.
L
i
n
g
a
R
a
o
President (Technical
Affairs)
M
r
.
V
.
C
N
a
n
n
a
p
a
n
e
n
i
C
h
a
i
r
m
a
n
a
n
d
M
a
n
a
g
i
n
g
D
i
r
e
c
t
o
r
Holds
Masters
degree in Pharmaceutical Administration from the Long Island
University,
USA
Over 4
decades of
experience in
the pharmaceutical
industry
M
r
.
R
a
j
e
e
v
N
a
n
n
a
p
a
n
e
n
i
Vice
Chairman
&
CEO
Holds bachelors degree in
Quantitative
Economics and History from
Tufts University,
Boston,
USA
Has 15 years
of
experience in
the
pharmaceutical
industry
Holds
Masters degree in
Science
(Applied
Chemistry) & Ph.D
in
Chemistry from
JNTU,
Hyderabad
Over 4
decades of
experience in
the pharmaceutical industry
and has been working with
Natco for
over 23
years
M
r
.
P
.
S
.
R
.
K
P
r
a
s
a
d
E
x
e
c
u
t
i
v
e
V
i
c
e
P
r
e
s
i
d
e
n
t
(
C
o
r
p
.
E
n
g
i
n
e
e
r
i
n
g
S
e
r
v
i
c
e
s
)
Holds
B.E.
Mech.
Engg. from
Andhra University,
Visakhapatnam
Responsible for looking after
the general administration, engineering, regulatory, training, environmental
matters, safety,
health,
production
and maintenance
activities of the
Company
M
r
.
R
a
j
e
s
h
C
h
e
b
i
y
a
m
V
i
c
e
P
r
e
s
i
d
e
n
t
-
A
c
q
u
i
s
i
t
i
o
n
s
,
I
n
s
t
i
t
u
t
i
o
n
a
l
I
n
v
e
s
t
o
r
M
g
m
t
.
&
C
o
r
p
o
r
a
t
e
C
o
m
m
u
n
i
c
a
t
i
o
n
s
M
r
.
S
.
V
.
V
.
N
.
A
p
p
a
R
a
o
CFO
Over 27 years
of
experience
including
22 years within
the Company
covering areas
of accounting, financial controller,
treasury
Responsible for finance
and
treasury functions at the
Company
Holds
MBA
from Babson College (USA)
and Masters degree in
Chemical
Engineering
from
University
of
Rhode
Island
20+
years
of
experience
across
supply
chain,
operations,
business
development,
sales
and
strategy
D
r
.
P
u
l
l
a
R
e
d
d
y
M
E
x
e
c
u
t
i
v
e
V
i
c
e
P
r
e
s
i
d
e
n
t
-
R
&
D
Holds
Masters
in Science (Chemistry)
and
Ph.D
in
Chemistry,
both
from
University
of
Hyderabad. Did
postdoctoral research
for
2.5
years
at
University
of Zurich,
Switzerland
24 years experience
at Natco
with
key
role in developing novel
commercially
viable
processes for
over 100
APIs
and
intermediates
Holds
M.
Pharm and Ph.D. (Pharmaceutics) degree from Nagpur
University
32 years
of
experience in
the Pharmaceutical Formulation industry. Responsible for Formulation
plant
operations, Product
development and Regulatory
compliance
D
r
.
R
a
m
i
R
e
d
d
y
B
Director -
Formulations
Bachelors in Commerce and Law from Andhra University, Fellow Member of Institute of Company Secretaries of India
(ICSI)
Over 34 years of experience including 25 years with the Company in legal, secretarial, corporate affairs and patent litigation areas
M
.
A
d
i
n
a
r
a
y
a
n
a
Company
Secretary &
VP-Legal
&
Corporate
Affairs
N
a
t
c
o
’
s
N
e
a
r
a
n
d
L
o
n
g
-
T
e
r
m
G
o
a
l
s
1
6
D
o
m
e
s
t
i
c
B
r
a
n
d
e
d
F
o
r
m
u
l
a
t
i
o
n
s
N
e
a
r
-
t
e
r
m
S
t
r
a
t
e
g
i
e
s
L
o
n
g
-
t
e
r
m
S
t
r
a
t
e
g
i
e
s
D
e
m
o
n
s
t
r
a
t
e
d
T
r
a
c
k
R
e
c
o
r
d
o
f
T
o
p
l
i
n
e
a
n
d
E
a
r
n
i
n
g
s
G
r
o
w
t
h
P
A
T
(
2
)
(
I
N
R
m
n
)
a
n
d
P
A
T
M
a
r
g
i
n
(
%
)
1
7
R
O
E
(
%
)
R
O
C
E
(
%
)
1,027
1,346
1,571
FY2
0
14
FY2
0
15
FY2
0
16
FY2
0
17
FY2
0
18
1
3
.
6
%
1
6
.
0
%
14.2%
15.9%
12.0%
29.5%
22.6%
FY2
0
14
FY2
0
15
FY2
0
16
FY2
0
17
FY2
0
18
18.7%
17.1%
16.9%
38.0%
28.9%
FY2
0
14
FY2
0
15
FY2
0
16
FY2
0
17
FY2
0
18
(1)
Represents consolidated gross
revenue and
includes other
income
(2)
Represents
PAT
after minority
interest
F
Y
2
0
1
4
a
n
d
F
Y
2
0
1
5
n
u
m
b
e
r
s
h
a
v
e
b
e
e
n
p
r
e
p
a
r
e
d
u
n
d
e
r
I
G
A
A
P
,
w
h
e
r
e
a
s
F
Y
2
0
1
6
a
n
d
F
Y
2
0
1
7
n
u
m
b
e
r
s
h
a
v
e
b
e
e
n
p
r
e
p
a
r
e
d
u
n
d
e
r
I
n
d
A
S
1
4
.
4
%
2
3
.
4
%
3
1
.
0
%
6
,9
62
4,860
H
i
s
t
o
r
i
c
a
l
F
i
n
a
n
c
i
a
l
s
C
o
n
s
o
l
i
d
a
t
e
d
P
r
o
f
i
t
&
L
o
s
s
S
t
a
t
e
m
e
n
t
(
I
N
R
m
n
)
1
8
FY2014 and FY2015 numbers have been prepared under IGAAP, whereas FY2016 and
FY2017
numbers
have been prepared under
Ind
AS
S
e
g
m
e
n
t
a
l
B
r
e
a
k
d
o
w
n
(
I
N
R
M
n
)
H
i
s
t
o
r
i
c
a
l
F
i
n
a
n
c
i
a
l
s
(
c
o
n
t
d
.
)
C
o
n
s
o
l
i
d
a
t
e
d
F
i
n
a
n
c
i
a
l
R
e
s
u
l
t
s
(
I
N
R
M
n
)
Note: The
Company adopted
Indian Accounting
Standards
("Ind AS")
from
1
April
2016 and
prior period figures
have been
reclassified
wherever
required to conform to the classification of the current
period.
1
9
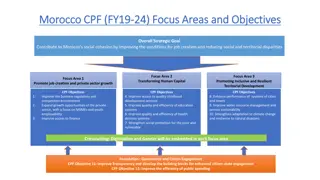
This presentation by Natco Pharma Limited provides general background information about the company's activities as of the presentation date. It includes forward-looking statements that involve risks and uncertainties, discussing the company's intentions, beliefs, and expectations. The material serves for general information purposes only and does not constitute an offer to sell securities or investment advice.

Download Presentation

Please find below an Image/Link to download the presentation.
The content on the website is provided AS IS for your information and personal use only. It may not be sold, licensed, or shared on other websites without obtaining consent from the author. Download presentation by click this link. If you encounter any issues during the download, it is possible that the publisher has removed the file from their server.
E N D
Presentation Transcript
INVESTOR PRESENTATION Q3 FY19, February 2019
Disclaimer / Important Disclosure THIS PRESENTATION (PRESENTATION) IS NOT AN OFFER TO SELL ANY SECURITIES OR A SOLICITATION TO BUY ANY SECURITIES OF NATCO PHARMA LIMITED OR ITS SUBSIDIARIES OR JOINT VENTURES (TOGETHER, THE COMPANY ). The material that follows is a Presentation of general background information about the Company s activities as at the date of the Presentation or as otherwise indicated. It is information given in summary form and does not purport to be complete and it cannot be guaranteed that such information is true and accurate. This Presentation has been prepared by and is the sole responsibility of the Company. By accessing this Presentation, you are agreeing to be bound by the trading restrictions. It is for general information purposes only and should not be consideredas a recommendationthat any investor should subscribe/ purchase the Company shares. This Presentation includes statements that are, or may be deemed to be, forward-looking statements . These forward-looking statements can be identified by the use of forward- looking terminology, including the terms believes , estimates , anticipates , projects , expects , intends , may , will , seeks or should or, in each case, their negative or other variations or comparable terminology, or by discussions of strategy, plans, aims, objectives, goals, future events or intentions. These forward-looking statements include all matters that are not historical facts. They appear in a number of places throughout this Presentation and include statements regarding the Company s intentions, beliefs or current expectations concerning, amongst other things, its results or operations, financial condition,liquidity, prospects, growth, strategies and the industry in which the Company operates. By their nature, forward-looking statements involve risks and uncertainties because they relate to events and depend on circumstances that may or may not occur in the future. Forward-looking statements are not guarantees of future performance including those relating to general business plans and strategy of the Company, its future outlook and growth prospects, and future developments in its businesses and its competitive and regulatory environment. No representation, warranty or undertaking, express or implied, is made or assurance given that such statements, views, projections or forecasts, if any, are correct or that the objectives of the Company will be achieved. There are some important factors that could cause material differences to Company s actual results. These include (i) our ability to successfully implement our strategy (ii) our growth and expansion plans (iii) changes in regulatory norms applicable to the Company (iv) technological changes (v) investment and business income (vi) cash flow projections etc. (vii) exposure to market as well as other risks. The Company, as such, makes no representation or warranty, express or implied, as to, and does not accept any responsibility or liability with respect to, the fairness, accuracy, completeness or correctness of any information or opinions contained herein. The information contained in this Presentation, unless otherwise specified is only current as of the date of this Presentation. The Company assumes no responsibility to publicly amend, modify or revise any forward looking statements, on the basis of any subsequent development, information or events, or otherwise. Unless otherwise stated in this Presentation, the information contained herein is based on management information and estimates. Any opinions expressed in this presentation are subject to change without notice. The presentation should not be construed as legal, tax, investment or other advice. None of the Company or any of its affiliates, advisers or representatives accepts any liability whatsoever for any loss howsoever arising from any information presented or contained in this presentation. The information contained in this presentation has not been independently verified. Furthermore, no person is authorized to give any information or make any representation which is not contained in, or is inconsistent with, this presentation. Any such extraneous or inconsistent information or representation, if given or made, should not be relied upon as having been authorized by or on behalf of the Company. Further, past performance is not necessarily indicative of futureresults. This document is just a Presentation for information purposes and private circulation only and is not intended to be a prospectus or offer document or a private placement offer letter (as defined or referred to, as the case may be, under the Companies Act, 2013). It is clarified that this Presentation is not intended to be a document offering for subscription or sale of any securities or inviting offers from the Indian public (including any section thereof) or from persons residing in any other jurisdiction including the United States for the subscription to or sale of any securities including the equity shares of the Company or any of its subsidiaries. No part of it should form the basis of or be relied upon in connection with any investment decision or any contract or commitment to purchase or subscribe for any securities. None of the Company s securities may be offered or sold in the United States without registrationunder the U.S. Securities Act of 1933, as amended, except pursuant to an exemption from registration there from. This document has not been and will not be reviewed or approved by a regulatory authority in India or by any stock exchange in India. This presentation is confidential and this presentation or any part thereof should not be used or relied upon by any other party or for any other purpose and should not be copied, reproduced, recirculated, redistributed, published in any media, website or otherwise, in any form or manner, in part or as a whole, without the express consent in writing of the Company. Any unauthorized use, disclosure or public dissemination of information contained herein is prohibited. The distribution of this presentation in certain jurisdictions may be restricted by law. Accordingly, any persons in possession of the aforesaid should inform themselves about and observe any such restrictions. 2
Natco Pharma at a Glance Represents consolidated revenue from operations (gross) Market capitalization as of 31 March 2018, using INR / USD exchange rate of 65.04 As of March 31, 2018 Represents consolidated revenue from operations (gross) Vertically integrated pharmaceutical company with presence across geographies - India, US and ROW Market capitalization as of 31 March 2018, using INR / USD exchange rate of 65.04 Strong brand position in the domestic Oncology and Hepatitis C( Hep-C ) segments - Portfolio of brands catering to various oncology diseases including breast, bone, lung and ovarian cancer - Launched the generic version of Gilead s Sovaldi (Sofosbuvir) and its combinations for the treatment of Hep-C in India As of March 31, 2018 Focused on complex generics for the US Markets with niche Para IV and Para III filings Strong focus on R&D with over 400 employees dedicated to R&D(3) Expanding into Niche Agrichemical business, leveraging on its Chemistry and manufacturing skills Total revenues(1) of INR 22,424 mn for the financial year ended 31st March 2018 Listed on the BSE and NSE with a market capitalization (2) of USD2.14bn Incorporated in 1981 and headquartered in Hyderabad with over 4,830 employees across all locations (3) 3 (1) (2) Represents consolidated revenue from operations(gross) Market capitalization as of 31 March 2018, using INR / USD exchange rate of 65.04
Track Record of Consistent Growth Strong Revenue(1)Growth OwnershipStructure(3) INRmn 22,424 20,789 10,897 8,402 7,556 Promoters, 48.42% Public, 51.58% FY2014 FY2015 FY2016 FY2017 FY2018 And Robust EBITDA and PAT(2)Margins EBITDA INRmn 26% 25% 26% 34% 43% Natco Pharma s Stock Performance over the past 4 and half years(3) 9,688 6,973 2,823 2,131 1,960 FY2014 FY2015 FY2016 FY2017 FY2018 PAT(2) INRmn 16% 14% 31% 14% 23% 6,962 4,860 1,571 1,346 1,027 FY2014 FY2015 FY2016 FY2017 FY2018 4 FY2014and FY2015numbershavebeen preparedunderIGAAP, whereasFY2016, FY2017and FY2018numbershavebeen preparedunderInd AS (1) Representsconsolidatedgrossrevenueand includesotherincome (2) Represents PAT after minorityinterest (3) 2018 Source: BSE, as of December 31 # Margins
Key Business Segments Formulations API Others (Domestic &Exports) Domestic International Operations in Brazil, Canada, Singapore and Australia Strong brand position in the domestic oncology and Hepatitis- C segments Recent foray into the Cardiology and Diabetology segments Specialist sales force of over 350 personnel and over 400 distributors Fall in FY18 revenue due to decline in HepC market size. Expect growth with target launch of 8-10 molecules per year Focused on complex generics for the US Front end partnerships with leading global generic pharma companies Niche Para IV and Para III filings Emerging presence in Asia, Europe and developing markets Strategically important division Vertical integration for its Finished Dosage Formulation ( FDF )portfolio Filed 42 DMFs in the US with niche products under development Exports focused on Europe and emerging markets Selective contract manufacturing business and other operating income Overview FY18Revenue (INRmn) 7,202* 10,418 2,854 1,950 13% FY18Revenue Contribution 9% 32% 47% - 18% GrowthFY18 over FY17 25% 55% 10% 5 Note: All numbers are Gross Revenue All data as of March 31, 2018 * Includes third partysales
US Market - Focus on Complex Generics US FDF product portfolio is predominantly focused on high-barrier-to-entry products that are typically characterised by one or more of thefollowing: - Intricate chemistry - Challenging delivery mechanism - Difficult or complex manufacturingprocess - May face complex legal and regulatorychallenges Key Products in Pipeline Low Risk Business Model through Partnerships with Global PharmaceuticalPlayers Key Brand Molecule Therapeutic Segment / Indication Para IV Adopted and successfully implementedpartnership Gilenya Fingolimod Multiple Sclerosis strategy for international formulationproducts Treanda Bendamustine Cancer, CLL Has product specific partnerships with global generic Nexavar Sorafenib Liver, Kidney Cancer players at different stages of a potential ANDA filing Tracleer Bosentan Hypertension Para III To Be Launched Low risk business model: Revlimid(1) Lenalidomide Multiple Myeloma Marketing partner typically responsible for the litigation and regulatory process to secure the ANDA approval Afinitor Everolimus (higher strength) Kidney Cancer Zytiga Abiraterone Prostate Cancer Multi-site approvals Multi-sourcing arrangements Tarceva Erlotinib NSCLC, Pancreatic Cancer Profit sharing arrangements with the front end Kyprolis Carfilzomib Multiple Myeloma partners. Aubagio Teriflunomide Multiple Sclerosis Eliquis Apixaban Anticoagulant Pipeline of niche and complex generics products in US Pomalyst Pomalidomide Multiple Myeloma 29 approved ANDAs(2) Sovaldi Sofosbuvir Anti-Viral / Hep C 16 Para IVs yet to be launched(2) Ibruvika Ibrutinib Cancer 6 (1) Launch conditional on approval (2) As of March 31, 2018. Approval received either by Natco or its marketing partner
Brand Molecule Dosage Form Therapautic Segment Strong Growth in Domestic Formulations Business Domestic Formulation Sales(1): Market LeadingGrowth Domestic Product Launches In FY 17-18, Natco had the following product launches In the Oncology segment Alphalan, Carfilnat and Pomalid In the Speciality Pharma segment Tafnat and Velpanat In the Cardiology segment Arganat and Dabigat INRmn FY 17-18 8,810* Brand Molecule Dosage Form Therapautic Segment 7,202* Denopsy Teriflunomide Posaconazole Tablets Speciality Pharma UPTO Q3 Posanat Injection Speciality Pharma FY19 6,342* Herduo Lapatinib Tablets Oncology Hepcinat Plus Sofosbuvir+ Daclatasvir Tablets SpecialityPharma Strong position in Oncology and Hepatitis-Cdomains Brands in excess of INR100mn+ sales in Oncologysegment 2,516* 6 1,983* Brands occupy the #1 positionin Hep-C segment 4 Sales force in India across Oncology, GastroHepatology, Cardiology and Diabetology FY2014 FY2015 FY2016 FY2017 FY2018 350+ 7 FY2014 and FY2015 numbers have been prepared under IGAAP, whereas FY2016, FY2017 and FY2018 numbers have been prepared under Ind AS (1) Represents gross revenue * Includes third party sales
Strong Market Position in Domestic Oncology Segment Oncology DivisionOverview Oncology Revenue Gross (INRmn) Entered the segment with launch of generic version of Imatinib in 2003 Portfolio of well recognized brands 6 brands with INR 100mn+ sales in 3,335 3,224 the oncology segment 2,526 Progressively widened its oncology product range from 6 in 2003-04 to 1,947 30(1) 1,572 Sales and marketing of the product is supported by approximately 70 sales representatives and strategically located logistics network of distributors FY2014 FY2015 FY2016 FY2017 FY2018 INR100mn+ Brands (FY18)(2) Oncology Portfolio (Veenat) (Lenalid) (Bortenat) Hematology Solid Tumors (Erlonat) (Geftinat) (Sorafenat) # ofActive Brands(1) 13 17 8 FY2014 and FY2015 numbers have been prepared under IGAAP, whereas FY2016, FY2017 and FY2018 numbers have been prepared under Ind AS (1) As on 31 March,2018 (2) Source:Company
Pharma Specialties Launched generic Sofosbuvir and its combinations for the treatment of Hep-C in India & Nepal under its brand Hepcinat & Hepcinat LP Gastro Hepatology Leading Market Position in Hep-C Portfolio Non-exclusive licensing agreement with Gilead Sciences for 105 countries including India Launched generic Daclatasvir in India under its brand Natdac and an oral fixed-dose combination of Sofosbuvir and Velapatasvir under its brand Velpanat Market leading positions across the Hep-C class of drugs in India Sales and marketing of the product is supported by approximately 120 salesrepresentatives Launched Hepcinat Plus, a generic fixed dose combination of Sofosbuvir and Daclatasvir for the first time in India Launched Tenofovir Alafenamide tablets under its brand Tafnat as an extensionto existing Hep B portfolio of Tenofovir (Teravir) & Entecavir (X-Vir) tablets Emerging portfolioof Hep B Extending the Hep-C Franchise Foraying into RoW markets Expanding Into Emerging Markets Of Asia And Africa Import Permits & ApprovalsReceived Access via Agreement withGilead Import permits / approvals for Hep-C related drug received in 14 countries(1) 9 (1) IncludingIndia
Expanding Domestic Presence with CnD Division Cardiology and Diabetology Launched Cardiology and Diabetology (CnD) division in early 2017 First to launch Argatroban injection and Dabigatran in India for treatment of patients with thrombosis syndrome Focus will be on niche molecules with high barriers to entry 10
Expanding RoW Presence Focus on Canada, Brazil and other RoW markets Hep-C driven markets Canada Received approvals and import permits for 14 countries(1) Launched Oseltamivir (genericdrug of Tamiflu) (30mg, 45mg,75mg) 13 approvals Successful listings in major provinces and retail chains Asia Pacific (IncludingAustralia) Presence in Singapore (8 approvals)and Australia Europe Brazil Distribution arrangements with our business partner to sell our productsin Eastern Europe, UK and Germany Commenced operationsin 2011 Filed multipleoncology products Received 1st product approval for Letrozole 11 (1) Including India Note: All data as of March 31,2018
In-House API Development with Vertical Integration for Key Formulation Products Mekaguda Facility Chennai Facility Strategically important business develops APIs primarily for captive consumption of its FDF portfolio as well as third party sales Portfolio of 42 US DMFs(1) with with niche products underdevelopment Focuses on complex molecules in oncology and CNS segments Other therapeutic areas of focus includes Anti-asthmatic, Anti- depressant, Anti-migraine, Anti-osteoporosis and G I Disorders Cytotoxic API s and Biotechnologybased products Complex chemistry peptides Chemistry Skills Exports are focused on the US, EU, Canada, Latin America and South- East Asia Synthetic chemistry Vertical integration for several APIs a key competitiveadvantage GMP, USFDA, German Health Authority, PMDA (Japan), Cofepris (Mexico) Key Regulatory Approvals API Strengths GMP, USFDA Complex multi-step synthesis & scale-up Semi-synthetic fusion technologies Fermentation / Biotech / Synthetic / Separation technologies US FDA audit with Zero observations completed in February 2018 US FDA audit EIR Received August 2016 Last US FDA Audit Containment / High potency APIs Peptide (Solid phase) pharmaceuticals Expansion plans to augment API manufacturingcapacity 12 (1) As of March 31,2018
Research & Development Capabilities R&D capabilitiesdemonstrated by its complex and niche product filings in formulations and API segments 29 ANDAs Approved(2) Two research facilities with capabilities across synthetic chemistry, biotech & fermentation, nano pharmaceuticals, new drug discovery & cell biology R&D Expense (INRmn) and as % of StandaloneRevenue 16 Para IVs to beLaunched(2) 6.7% 6.0% 7.8% 7.1% 6.4% 1,665 1,216 703 517 407 42 US DMFsFiled(2) FY2014 FY2015 FY2016 FY2017 FY2018 Talented Pool of Scientists (Total no:271)(1) Process Development Analytical Development 10% 4% 11% 5% 3% 30% 39% PhD DQA Masters Biotech & Fermentation Others 59% Nanoformulations 39% Several International and Indian patents filed and granted Discovery Note: Rounded off to the nearestdecimal Note: Rounded off to the nearestdecimal Over 35 R&D laboratories in 2 researchfacilities 13 FY2014 and FY2015 numbers have been prepared under IGAAP, whereas FY2016 and FY2017 numbers have been prepared under Ind AS (1) As of March 31,2018. (2) As of March 31, 2018. Approval received either by Natco or its marketingpartner # % of standalone revenues
Commitment to Manufacturing Excellence with a Culture of Quality and Compliance International MarketsFormulations Kothur Facility Visakhapatnam Facility Tablets, Capsules, Pellets, Injectables Cytotoxic & other Oral Solid Dosages Capability Key Regulatory Approvals GMP, USFDA, German Health Authority, ANVISA na Targeted towards US & other International regulated markets Other Highlights Located in a Special Economic Zone (SEZ) US FDA audit EIR Received July 2017 Facility license received. Qualification batches in progress Domestic MarketFormulations Nagarjuna Sagar Facility Dehradun Unit 6 Facility Dehradun Unit 7 Facility Guwahati Facility Ampoules, Vials, Lyophilized vials, Parenterals, Sterile Dry Powders Tablets, Capsules, Injectables Tablets, Capsules Tablets, Capsules Capability Key Regulatory Approvals GMP, Public Health Service of the Netherlands (EU GMP) GMP GMP GMP Compliant Facility 14 Under development
Experienced Management Mr. V.C Nannapaneni Chairman andManaging Director Holds Masters degree in Pharmaceutical Administration from the Long Island University,USA Over 4 decades of experience in the pharmaceuticalindustry Holds bachelors degree in Quantitative Economics and History from Tufts University, Boston,USA Mr. RajeevNannapaneni Vice Chairman & CEO Has 15 years of experience in the pharmaceuticalindustry Mr. P.S.R.K Prasad Executive Vice President (Corp. EngineeringServices) Holds B.E. Mech. Engg. from Andhra University,Visakhapatnam Responsible for looking after the general administration, engineering, regulatory, training, environmental matters, safety, health, production and maintenance activities of theCompany Holds Masters degree in Science (Applied Chemistry) & Ph.D in Chemistry from JNTU,Hyderabad Dr. Linga Rao President (TechnicalAffairs) Over 4 decades of experience in the pharmaceutical industry and has been working with Natco for over 23years Bachelors in Commerce and Law from Andhra University, Fellow Member of Institute of Company Secretaries of India (ICSI) M. Adinarayana Company Secretary & VP-Legal & CorporateAffairs Over 34 years of experience including 25 years with the Company in legal, secretarial, corporate affairs and patent litigation areas Over 27 years of experience including 22 years within the Company covering areas of accounting, financial controller,treasury Mr. S.V.V.N.AppaRao CFO Responsible for finance and treasury functions at theCompany Holds Masters in Science (Chemistry) and Ph.D in Chemistry, both from University of Hyderabad. Did postdoctoral researchfor 2.5 years at University of Zurich, Switzerland Dr. Pulla Reddy M Executive Vice President- R&D 24 years experience at Natco with key role in developing novel commercially viable processes for over 100 APIs and intermediates Holds M. Pharm and Ph.D. (Pharmaceutics) degree from NagpurUniversity Dr. Rami Reddy B Director - Formulations 32 years of experience in the Pharmaceutical Formulation industry. Responsible for Formulation plant operations, Product development and Regulatorycompliance Mr. Rajesh Chebiyam Vice President -Acquisitions, Institutional Investor Mgmt. & Corporate Communications Holds MBA from Babson College (USA) and Masters degree in Chemical Engineering from University of RhodeIsland 20+ years of experience across supply chain, operations,business development, sales and strategy 15
Natcos Near and Long-Term Goals Domestic Branded Formulations Complex Generics & ExportMarkets Focus on growth in key subsidiaries of Canada & Maintain leadership position in Oncology and Brazil Hepatitis-C segment Near-term Strategies Intensify the focus of CnD pipeline forniche Intensify regulatory filings rate in RoWmarkets launches led by Hep-C portfolio Launch 8-10 new products Entered niche agrichemical business Focus on a select few high-potential filings, Enter new attractivesegments predominantly differentiated products througheither Growth through inorganicstrategies Long-term Strategies Novel Drug Delivery Systems (NDDS) or complex chemistries Strategic alliances in RoW markets for furthergrowth 16
Demonstrated Track Record of Topline and Earnings Growth FY2014 and FY2015 numbers have been prepared under IGAAP, whereas FY2016 and FY2017 numbers have been prepared under Ind AS Total Gross Revenue(1)(INRmn) EBITDA (INRmn) and EBITDA Margin (%) 33.5% 25.9% 25.4% 25.9% 43.2% 20,789 22,424 10,897 9,688 8,402 7,556 6,973 2,823 2,131 1,960 FY2014 FY2015 FY2016 FY2017 FY2018 FY2014 FY2015 FY2016 FY2017 FY2018 PAT(2) (INRmn) and PAT Margin (%) ROE (%) ROCE (%) 31.0% 16.0% 14.4% 23.4% 13.6% 38.0% 6,962 29.5% 28.9% 4,860 22.6% 18.7% 15.9% 17.1% 16.9% 14.2% 1,571 1,346 12.0% 1,027 FY2014 FY2015 FY2016 FY2017 FY2018 FY2014 FY2015 FY2016 FY2017 FY2018 FY2014 FY2015 FY2016 FY2017 FY2018 (1) (2) Represents consolidated gross revenue and includes other income Represents PAT after minority interest 17
Historical Financials Consolidated Balance Sheet (INRmn) Particulars ASSETS Non-current assets (a) Property, plant and equipment (b) Capital work-in-progress (c) Intangibleassets (d) Financial assets Investments Other financialassets (e) Current-tax assets (net) (f) Other non-currentassets Consolidated Profit & Loss Statement(INRmn) Particulars Revenue Revenue from operations (Refer note 5) Other income Totalrevenues Expenses Cost of materials consumed Excise duty (Refer note 5) Purchases of stock-in-trade Changes in inventories of finished goods, stock-in -trade and work-in- progress Employee benefits expense Finance costs Depreciation and amortisation expense Other expenses Totalexpenses 31-March-2018 31-March-2017 31-March-2018 31-March-2017 22,020 404 22,424 20,650 139 20,789 10,127 4,800 8,272 3,363 59 58 5,208 448 971 (188) 3,905 172 459 (253) 81 150 18 609 1 131 - 478 15,844 12,303 2,432 185 544 4,945 14,545 3,256 154 662 5,197 13,552 Current assets (a) Inventories (b) Financial Assets Investments Trade receivables Cash and cash equivalents Bank balances other than cash and cash equivalents Loans Other financialassets (c) Other currentassets 4,384 3,489 684 321 6,375 217 1,620 4,752 235 123 Profit beforetax 8,872 6,244 45 35 752 Tax expense / (credit) Current tax Deferred tax Minimum alternative tax credit Tax for earlieryears 6,142 1,840 21,307 37,151 1,354 2,199 1,166 10,873 23,176 1 - - (279) Totalassets 40 - EQUITY AND LIABILITIES Equity (a) Equity share capital (b) Other equity Equity attributable toowners 6,952 4,849 Profit aftertax 369 349 30,353 30,722 16,144 16,493 Other comprehensive income (net of taxes) Items that will not be reclassified to profit orloss Re-measurement gains/(losses) on defined benefit plans Net (loss)/gain on FVTOCI equitysecurities Items that will be reclassified to profit orloss Exchange differences on translation of foreignoperations (42) (2) (50) 28 Non-controlling interest Total ofEquity 38 41 30,760 16,534 (8) (12) Liabilities Non-current liabilities (a) Financial liabilities Other financialliabilities (b) Provision for employee benefits (c) Deferred tax liabilities(net) Total comprehensiveincome 6,900 4,815 8 8 Profit attributableto: Owners of the parent Non-controlling interests 324 139 471 219 150 377 4,860 (11) 6,962 (10) Current liabilities (a) Financial liabilities Borrowings Trade payables Other financialliabilities (b) Other currentliabilities (c) Provision for employeebenefits (d) Current-tax liabilities(net) Total comprehensive income attributableto: Owners of the parent Non-controlling interests 6,910 (10) 4,826 (11) 1,732 2,691 1,024 310 137 2,216 2,627 1,014 257 Paid-up equity share capital of 2each Other equity (Revaluation reserve Nil) 349 369 16,144 30,353 18 133 26 Earnings per share (non-annualised) Basic (in ) Diluted (in ) 5,920 6,265 39.26 39.13 27.78 27.75 Total equity andliabilities 37,151 23,176 18 FY2014 and FY2015 numbers have been prepared under IGAAP, whereas FY2016 and FY2017 numbers have been prepared under Ind AS
Historical Financials (contd.) Consolidated Financial Results (INRMn) Segmental Breakdown (INRMn) Revenue Division Q3FY19 FY18 Q3FY18 FY17 Q3FY19 FY18 Q3 FY18 FY17 Total API Total Revenues 5,800 22,424 5736 20,789 API Gross Revenue 992.5 2,853.9 816.6 1,837.7 Formulation export and profit share 2,573.1 10,419.0 2,890.3 8276.0 EBITDA EBITDA Margin (%) 2317 9,688 2979 6,973 39.9% 43.20% 51.9% 33.50% Formulations Onco (including CnD) 942.5 3,380.6 848.3 3,224.3 Formulations, Brand Pharma Non - Onco Formulations, 3rd party, & miscel PAT (after minority interest) PAT Margin (%) 503.2 3,103.5 685.6 4,801.6 1593 6,962 2174 4,860 195.6 718.2 125.7 784.6 27.5% 31.00% 37.9% 23.40% Formulations Gross Revenue 4,214.4 17,620.9 4,549.9 17,086.1 Other Operating and Non - operating incomes 349.1 1,003.9 148.5 1,236.0 Stand-Alone Total Net Revenue Total Revenue, all subsidiaries 5,556.0 21,479 5,515.0 20,159.8 244.0 945.3 221.0 630.0 Consolidated Total Net Revenue 5,800.0 22,424.0 5,736.0 20789.8 19 Note: The Company adopted Indian Accounting Standards ("Ind AS") from 1 April 2016 and prior period figures have been reclassified wherever required to conform to the classification of the current period.


")