Investing in Transportation Performance Measures for Florida's Future
Explore the importance of performance measures in transportation planning for Florida, focusing on reliability, safety, congestion, and economic growth. Learn how targeted investments can improve infrastructure and reduce vulnerabilities for a more resilient transportation system by 2040.
Download Presentation

Please find below an Image/Link to download the presentation.
The content on the website is provided AS IS for your information and personal use only. It may not be sold, licensed, or shared on other websites without obtaining consent from the author. Download presentation by click this link. If you encounter any issues during the download, it is possible that the publisher has removed the file from their server.
E N D
Presentation Transcript
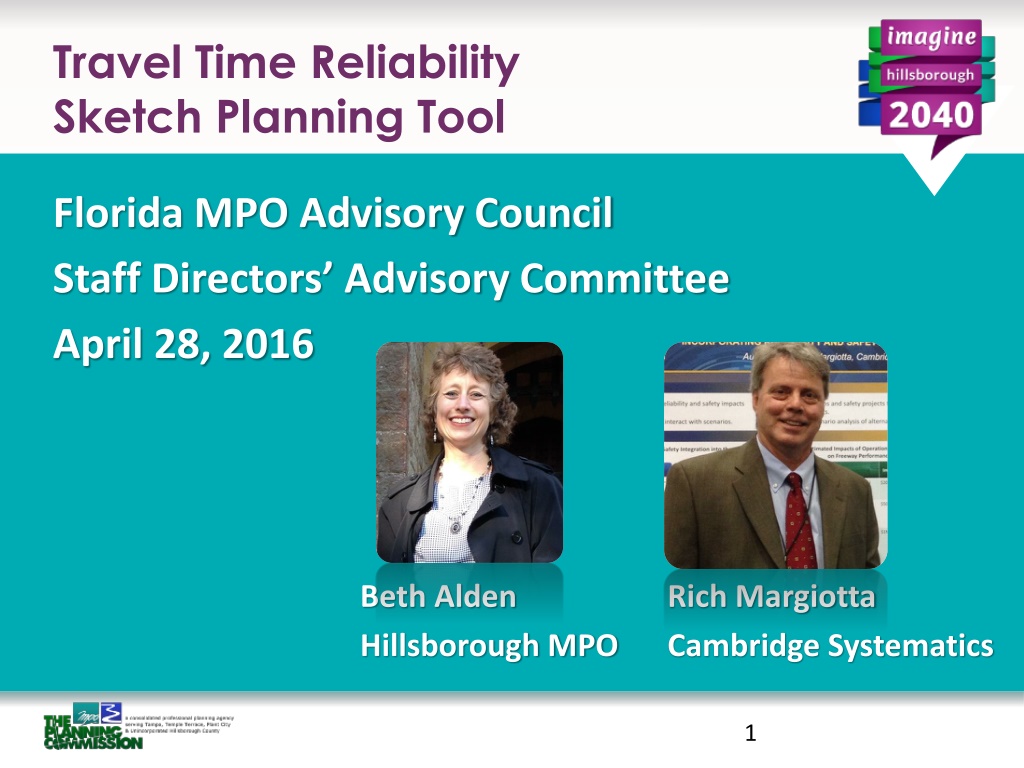
Travel Time Reliability Sketch Planning Tool Florida MPO Advisory Council Staff Directors Advisory Committee April 28, 2016 Beth Alden Hillsborough MPO Rich Margiotta Cambridge Systematics 1
MAP-21 & FAST are Performance-Based New required metrics for the Interstate and National Highway System: Pavement condition Bridge condition Fatalities and serious injuries Traffic congestion Freight movement *Measuring performance is only as good as the available data. *Statewide targets coming soon! *Metro targets from large MPOs required after!
2040 Transportation Plan = Many Kinds of Investments .. Preserve the System Minimize Traffic for Drivers & Shippers Grow Economic Activity Centers Reduce Crashes & Vulnerability Real Choices for Non- Drivers How can performance measures help us target limited resources? 3
What can we get if we invest in Reducing Crashes & Vulnerability EXAMPLE Level 1 CURRENT SPENDING LEVEL CONTINUES, 20 YEARS Fatality rate continues to be above national average 10-years to recover from direct hurricane hit Level 2 SAFETY SPENDING DOUBLES Fatality rate equal to the national average by 2040 Reduced recovery time from direct hurricane hit Level 3 SAFETY SPENDING TRIPLES Fatality rate % below the national average by 2040 Greatly reduced recovery time from direct hurricane hit
What can we get if we invest in Minimizing Congestion for Drivers & Shippers EXAMPLE Level 1 CURRENT SPENDING Peak-hour travel time is how much less reliable than today? Hours of truck delay Travel Time Variability: How much longer could it take you at rush hour? 7 Largest Counties in FL 3 Level 2 ATMS FULLY FUNDED Travel time % more reliable on major roads Reduced truck hot spots by % Hillsborough - Arterials 2.5x 2.5 Hillsborough - Freeways 2x 2 1.5x 1.5 1 Level 3 FWY ATMS FUNDED Level 2, plus increased reliability on freeways 0.5 0 2010 2013 Level 3 Level 3 Level 1 Level 1 2010 2013
Investment Programs: Low, Medium, or High? Preserve the System Min. Traffic for Drivers & Shippers 1920 responses 1964 responses Low 16% Low 26% High 33% High 34% Medium 51% Medium 40% Reduce Crashes & Vulnerability Real Choices When Not Driving 1921 responses 1886 responses Low 25% High 28% High 34% Low 34% Medium 47% Medium 32% 7
Performance of One-Cent Sales Tax Scenario Preserve the System Roads repaved every 17 years on average, meeting standards Aging bridges and buses replaced on time Level 3 Level 3 Reduce Crashes & Vulnerability Complete streets & intersection projects: crashes drop 21-50% Low-lying major roads usable 6 weeks after a Cat. 3 storm Level 2 Level 2 Minimize Traffic for Drivers & Shippers Intersections work 17% better, and freeways 10% better Two new RR overpasses remove 10-hour daily road closure Level 3 Level 3 Real Choices when Not Driving Add 240 miles of trails & sidepaths by 2040 Frequent bus service for 46% of people & jobs, somewhat frequent service (every -hour) for 64% Level 3 Level 3 8
Reliability Prediction: SHRP 2 C11 Part of a larger FDOT effort to get SHRP 2 analytic products into practice Methodology doesn t require much data: sketch planning level AADT, capacity, incident characteristics Considers both recurring and incident delay Predicts several reliability metrics Planning Time Index used: 95th %ile TT/Ideal TT 9
Enhancements Underway Create user grade post-processor software for other Florida MPOs Funded through an FHWA grant Expand types of improvements considered Account for synergies between safety and capital expansion/operations projects Update internal relationships 10
Types of Improvements Considered Operations Ramp metering, incident management, DMS, variable speed limits, HOV-to-HOT, hard shoulder running, signal coordination, adaptive signal control, integrated corridor management Different levels of aggressiveness for some strategies (e.g., incident management) Strategies can be bundled 11
Types of Improvements Considered (cont.) Safety Red light enforcement, incident management, ramp metering, bike lanes, delineation, lighting, conversion to roundabout, parking prohibition, pedestrian crosswalks and beacons, add raised median, road diet, add lanes + median to 2-lane, add turn lanes Possibly connected/automated vehicles Can be bundled 12
Next Steps/ Timing What you can do Feedback on types of projects considered Tell us if you are currently compiling crash data Beta testing Schedule Prototype: June 30 Beta version: July 30 Final product: September 15 13
Contact Information Rich Margiotta rmargiotta@camsys.com Doug McLeod Douglas.McLeod@dot.state.fl.us 14
