Introduction to R Shiny: Building Interactive Web Applications
Learn about R Shiny, a tool for creating interactive web applications to display R outputs such as tables, graphs, and maps. Explore examples and tips for developing Shiny apps, along with useful resources.

Download Presentation

Please find below an Image/Link to download the presentation.
The content on the website is provided AS IS for your information and personal use only. It may not be sold, licensed, or shared on other websites without obtaining consent from the author.If you encounter any issues during the download, it is possible that the publisher has removed the file from their server.
You are allowed to download the files provided on this website for personal or commercial use, subject to the condition that they are used lawfully. All files are the property of their respective owners.
The content on the website is provided AS IS for your information and personal use only. It may not be sold, licensed, or shared on other websites without obtaining consent from the author.
E N D
Presentation Transcript
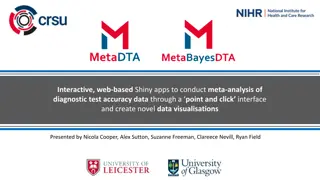
An quick intro to R Shiny Michelle Clements R user group @ LSHTM 2020-01-31
Contents What is Shiny? How Shiny works Looking at some code Extensions to the example Publishing Shiny apps Using Shiny within studies & trials Tips & Resources
What is Shiny? A way of displaying R output in a webpage Can display tables, graphs, maps, images, text Interactive! Allows the user to select the data or parameters of interest to them
Shiny examples RVC modelling explainer: https://royalveterinarycollege.shinyapps.io/epidemix/ Blood banks in India https://opndt.shinyapps.io/bloodbank_india/ Centre for Burden & Risk Assessment prevalence tool http://prevalence.cbra.be/shiny/truePrev/ John Hopkins methodology tool https://olssol.shinyapps.io/idem/
Developing a Shiny app File names have to be in the same folder and either: server.R and ui.R app.R We ll focus on separate but app.R just uses server and ui functions Separate can be easier for bigger apps Information gets passed back and forth between server and ui scripts/functions Have to run together and not sequentially Run locally using the run app button in R Studio R Studio then listens for change to the inputs
Example to use today K-means clustering on iris data Available here: https://shiny.rstudio.com/gallery/kmeans-example.html So, how does it work?
Inputs Outputs ui.R: controls the web page: displays inputs & outputs 1. Make the inputs: give each input an input_name 3. Display (output) output_name server.R: uses inputs to make outputs 2. Use input$input_name to make (render) output$output_name (text, table, plot etc.)
The technical bits 1. Make the inputs in ui.R: inputId = input_name 2. Use input$input_name in server.R to render output$ouput_name 3. Display output in ui.R: outputId = output_name Taken from RStudio shiny cheatsheet
K-means example 1. Create numeric input called clusters between 1-9, with default value 3 2. Do clustering with number of clusters = input$clusters and colour output$plot1 with results 3. Display plot1
Shiny apps in real life Shiny apps can get more complicated Variety of inputs & outputs Tabbed display Inputs updating depending on previous input selected Upload and download data Download reports Optimising speed with large datasets/analyses (If the app gets too complicated think about other tools such as d3) However, the basic structure remains: Declaring inputs (ui) Use inputs to render outputs (server) Displaying outputs (ui)
Publishing Shiny apps Shiny apps should be hosted somewhere Hosted on R Studio servers: https://www.shinyapps.io/ Free for open apps, $100/month for password protected One option can be to have users upload csv files of data (but data still goes to servers) Hosted in-house (R Studio server) Free without authentication. $5k/year with authentication In-house authentication possible if IT are willing Install R on everyone s laptops and run locally Can put .exe files on people s computers that just run the app (if they have R Studio installed)
Using Shiny within studies & trials? Study & Trial set-up Sample size options Study & Trial management Data cleaning Visit schedules Be careful with where you re putting the data! Sharing results Subgroup results Methodology Simulation studies Other ideas? Shiny is especially good for repetitive tasks
Shiny tips Always get the R code working before putting it into shiny I assign my inputs at the top (e.g. xcol <- Sepal.length ) Then get my analyses and graphs working using these refs Then transfer to shiny later Start from a working shiny app File -> new file -> shiny web app Gives you a working shiny app I always start with this Work iteratively Use different folders to build up Or Git It helps to be able to wind back if needed!
Resources R Studio tutorials are great https://shiny.rstudio.com/tutorial/ R Studio gallery has lots of small examples to copy https://shiny.rstudio.com/gallery/