Introduction to Bayesian Classifiers in Data Mining
Explore the use of Bayesian classifiers in data mining for classification tasks. Learn about the probabilistic framework, Bayes' theorem, and how to estimate posterior probabilities for predicting class labels based on given attributes. Utilize examples and techniques to understand and apply Bayesian classification effectively.
Download Presentation

Please find below an Image/Link to download the presentation.
The content on the website is provided AS IS for your information and personal use only. It may not be sold, licensed, or shared on other websites without obtaining consent from the author. If you encounter any issues during the download, it is possible that the publisher has removed the file from their server.
You are allowed to download the files provided on this website for personal or commercial use, subject to the condition that they are used lawfully. All files are the property of their respective owners.
The content on the website is provided AS IS for your information and personal use only. It may not be sold, licensed, or shared on other websites without obtaining consent from the author.
E N D
Presentation Transcript
Data Mining Classification: Alternative Techniques Bayesian Classifiers Introduction to Data Mining, 2nd Edition by Tan, Steinbach, Karpatne, Kumar ?1
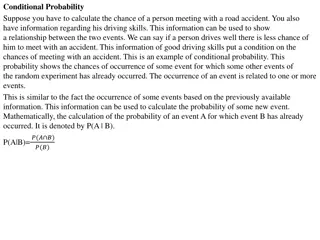
Bayes Classifier A probabilistic framework for solving classification problems Conditional Probability: ( P , ) P X Y = ( | ) P Y X ( X ) X ( P , ) P Y = ( | ) P X Y ( ) Y Bayes theorem: ( | ) ( ) P X Y P Y = ( | ) P Y X ( ) P X 2/08/2021 Introduction to Data Mining, 2nd Edition 2
Using Bayes Theorem for Classification Consider each attribute and class label as random variables Given a record with attributes (X1, X2, , Xd), the goal is to predict class Y categorical categorical continuous class Tid Refund Marital Taxable Income Evade Status 1 Yes Single 125K No Specifically, we want to find the value of Y that maximizes P(Y| X1, X2, , Xd ) 2 No Married 100K No 3 No Single 70K No 4 Yes Married 120K No 5 No Divorced 95K Yes Can we estimate P(Y| X1, X2, , Xd ) directly from data? 6 No Married 60K No 7 Yes Divorced 220K No 8 No Single 85K Yes 9 No Married 75K No 10 No Single 90K Yes 10 2/08/2021 Introduction to Data Mining, 2nd Edition 3
Using Bayes Theorem for Classification Approach: compute posterior probability P(Y | X1, X2, , Xd) using the Bayes theorem ( | ) ( ) P X X X Y P Y = ( | ) 1 P 2 X P Y X X X d 1 2 n ( ) X X 1 2 d Maximum a-posteriori: Choose Y that maximizes P(Y | X1, X2, , Xd) Equivalent to choosing value of Y that maximizes P(X1, X2, , Xd|Y) P(Y) How to estimate P(X1, X2, , Xd | Y )? 2/08/2021 Introduction to Data Mining, 2nd Edition 4
Example Data Given a Test Record: categorical categorical continuous = = = Refund ( No, Divorced, Income 120K) X class We need to estimate P(Evade = Yes | X) and P(Evade = No | X) Tid Refund Marital Taxable Income Evade Status 1 Yes Single 125K No 2 No Married 100K No 3 No Single 70K No In the following we will replace Evade = Yes by Yes, and Evade = No by No 4 Yes Married 120K No 5 No Divorced 95K Yes 6 No Married 60K No 7 Yes Divorced 220K No 8 No Single 85K Yes 9 No Married 75K No 10 No Single 90K Yes 10 2/08/2021 Introduction to Data Mining, 2nd Edition 5
Example Data Given a Test Record: categorical categorical continuous = = = Refund ( No, Divorced, Income 120K) X class Tid Refund Marital Taxable Income Evade Status 1 Yes Single 125K No 2 No Married 100K No 3 No Single 70K No 4 Yes Married 120K No 5 No Divorced 95K Yes 6 No Married 60K No 7 Yes Divorced 220K No 8 No Single 85K Yes 9 No Married 75K No 10 No Single 90K Yes 10 2/08/2021 Introduction to Data Mining, 2nd Edition 6
Conditional Independence X and Y are conditionally independent given Z if P(X|YZ) = P(X|Z) Example: Arm length and reading skills Young child has shorter arm length and limited reading skills, compared to adults If age is fixed, no apparent relationship between arm length and reading skills Arm length and reading skills are conditionally independent given age 2/08/2021 Introduction to Data Mining, 2nd Edition 7
Nave Bayes Classifier Assume independence among attributes Xi when class is given: P(X1, X2, , Xd |Yj) = P(X1| Yj) P(X2| Yj) P(Xd| Yj) Now we can estimate P(Xi| Yj) for all Xi and Yj combinations from the training data New point is classified to Yj if P(Yj) P(Xi| Yj) is maximal. 2/08/2021 Introduction to Data Mining, 2nd Edition 8
Nave Bayes on Example Data Given a Test Record: categorical categorical continuous = = = Refund ( No, Divorced, Income 120K) X class Tid Refund Marital Taxable Income Evade P(X | Yes) = Status P(Refund = No | Yes) x P(Divorced | Yes) x P(Income = 120K | Yes) 1 Yes Single 125K No 2 No Married 100K No 3 No Single 70K No 4 Yes Married 120K No 5 No Divorced 95K Yes 6 No Married 60K No P(X | No) = 7 Yes Divorced 220K No P(Refund = No | No) x P(Divorced | No) x P(Income = 120K | No) 8 No Single 85K Yes 9 No Married 75K No 10 No Single 90K Yes 10 2/08/2021 Introduction to Data Mining, 2nd Edition 9
Estimate Probabilities from Data categorical categorical continuous class P(y) = fraction of instances of class y e.g., P(No) = 7/10, P(Yes) = 3/10 Tid Refund Marital Taxable Income Evade Status 1 Yes Single 125K No For categorical attributes: P(Xi =c| y) = nc/ n 2 No Married 100K No 3 No Single 70K No 4 Yes Married 120K No where |Xi =c| is number of instances having attribute value Xi =c and belonging to class y Examples: 5 No Divorced 95K Yes 6 No Married 60K No 7 Yes Divorced 220K No 8 No Single 85K Yes 9 No Married 75K No 10 No Single 90K Yes P(Status=Married|No) = 4/7 P(Refund=Yes|Yes)=0 10 2/08/2021 Introduction to Data Mining, 2nd Edition 10
Estimate Probabilities from Data For continuous attributes: Discretization: Partition the range into bins: Replace continuous value with bin value Attribute changed from continuous to ordinal Probability density estimation: Assume attribute follows a normal distribution Use data to estimate parameters of distribution (e.g., mean and standard deviation) Once probability distribution is known, use it to estimate the conditional probability P(Xi|Y) 2/08/2021 Introduction to Data Mining, 2nd Edition 11
Estimate Probabilities from Data categorical categorical continuous class Normal distribution: Tid Refund Marital Taxable Income Evade Status 2 ( ) X i ij 1 1 Yes Single 125K No 2 ij 2 = ( | ) P X Y e i j 2 No Married 100K No 2 ij 2 3 No Single 70K No One for each (Xi,Yi) pair 4 Yes Married 120K No 5 No Divorced 95K Yes For (Income, Class=No): If Class=No sample mean = 110 sample variance = 2975 6 No Married 60K No 7 Yes Divorced 220K No 8 No Single 85K Yes 9 No Married 75K No 10 No Single 90K Yes 10 1 2 110 ( 120 ) = = = ( 120 | ) 0072 . 0 P Income No e 2 ( 2975 ) 2 54 ( 54 . ) 2/08/2021 Introduction to Data Mining, 2nd Edition 12
Example of Nave Bayes Classifier Given a Test Record: = = = Refund ( No, Divorced, Income 120K) X Na ve Bayes Classifier: P(Refund = Yes | No) = 3/7 P(Refund = No | No) = 4/7 P(Refund = Yes | Yes) = 0 P(Refund = No | Yes) = 1 P(Marital Status = Single | No) = 2/7 P(Marital Status = Divorced | No) = 1/7 P(Marital Status = Married | No) = 4/7 P(Marital Status = Single | Yes) = 2/3 P(Marital Status = Divorced | Yes) = 1/3 P(Marital Status = Married | Yes) = 0 P(X | No) = P(Refund=No | No) = 4/7 1/7 0.0072 = 0.0006 P(Divorced | No) P(Income=120K | No) P(X | Yes) = P(Refund=No | Yes) P(Divorced | Yes) P(Income=120K | Yes) = 1 1/3 1.2 10-9 = 4 10-10 For Taxable Income: If class = No: sample mean = 110 sample variance = 2975 If class = Yes: sample mean = 90 sample variance = 25 Since P(X|No)P(No) > P(X|Yes)P(Yes) Therefore P(No|X) > P(Yes|X) => Class = No 2/08/2021 Introduction to Data Mining, 2nd Edition 13
Nave Bayes Classifier can make decisions with partial information about attributes in the test record Even in absence of information about any attributes, we can use Apriori Probabilities of Class Variable: P(Yes) = 3/10 P(No) = 7/10 If we only know that marital status is Divorced, then: P(Yes | Divorced) = 1/3 x 3/10 / P(Divorced) P(No | Divorced) = 1/7 x 7/10 / P(Divorced) Na ve Bayes Classifier: P(Refund = Yes | No) = 3/7 P(Refund = No | No) = 4/7 P(Refund = Yes | Yes) = 0 P(Refund = No | Yes) = 1 P(Marital Status = Single | No) = 2/7 P(Marital Status = Divorced | No) = 1/7 P(Marital Status = Married | No) = 4/7 P(Marital Status = Single | Yes) = 2/3 P(Marital Status = Divorced | Yes) = 1/3 P(Marital Status = Married | Yes) = 0 If we also know that Refund = No, then P(Yes | Refund = No, Divorced) = 1 x 1/3 x 3/10 / P(Divorced, Refund = No) P(No | Refund = No, Divorced) = 4/7 x 1/7 x 7/10 / P(Divorced, Refund = No) If we also know that Taxable Income = 120, then P(Yes | Refund = No, Divorced, Income = 120) = 1.2 x10-9 x 1 x 1/3 x 3/10 / P(Divorced, Refund = No, Income = 120 ) P(No | Refund = No, Divorced Income = 120) = 0.0072 x 4/7 x 1/7 x 7/10 / P(Divorced, Refund = No, Income = 120) For Taxable Income: If class = No: sample mean = 110 sample variance = 2975 If class = Yes: sample mean = 90 sample variance = 25 2/08/2021 Introduction to Data Mining, 2nd Edition 14
Issues with Nave Bayes Classifier Given a Test Record: X = (Married) Na ve Bayes Classifier: P(Yes) = 3/10 P(No) = 7/10 P(Yes | Married) = 0 x 3/10 / P(Married) P(No | Married) = 4/7 x 7/10 / P(Married) P(Refund = Yes | No) = 3/7 P(Refund = No | No) = 4/7 P(Refund = Yes | Yes) = 0 P(Refund = No | Yes) = 1 P(Marital Status = Single | No) = 2/7 P(Marital Status = Divorced | No) = 1/7 P(Marital Status = Married | No) = 4/7 P(Marital Status = Single | Yes) = 2/3 P(Marital Status = Divorced | Yes) = 1/3 P(Marital Status = Married | Yes) = 0 For Taxable Income: If class = No: sample mean = 110 sample variance = 2975 If class = Yes: sample mean = 90 sample variance = 25 2/08/2021 Introduction to Data Mining, 2nd Edition 15
Issues with Nave Bayes Classifier categorical categorical continuous class Na ve Bayes Classifier: Consider the table with Tid = 7 deleted Tid Refund Marital Taxable Income P(Refund = Yes | No) = 2/6 P(Refund = No | No) = 4/6 P(Refund = Yes | Yes) = 0 P(Refund = No | Yes) = 1 P(Marital Status = Single | No) = 2/6 P(Marital Status = Divorced | No) = 0 P(Marital Status = Married | No) = 4/6 P(Marital Status = Single | Yes) = 2/3 P(Marital Status = Divorced | Yes) = 1/3 P(Marital Status = Married | Yes) = 0/3 For Taxable Income: If class = No: sample mean = 91 sample variance = 685 If class = No: sample mean = 90 sample variance = 25 Evade Status 1 Yes Single 125K No 2 No Married 100K No 3 No Single 70K No 4 Yes Married 120K No 5 No Divorced 95K Yes 6 No Married 60K No 7 Yes Divorced 220K No 8 No Single 85K Yes 9 No Married 75K No 10 No Single 90K Yes 10 Given X = (Refund = Yes, Divorced, 120K) P(X | No) = 2/6 X 0 X 0.0083 = 0 P(X | Yes) = 0 X 1/3 X 1.2 X 10-9 = 0 Na ve Bayes will not be able to classify X as Yes or No! 2/08/2021 Introduction to Data Mining, 2nd Edition 16
Issues with Nave Bayes Classifier If one of the conditional probabilities is zero, then the entire expression becomes zero Need to use other estimates of conditional probabilities than simple fractions Probability estimation: n: number of training instances belonging to class y nc: number of instances with Xi = c and Y = y v: total number of attribute values that Xican take p: initial estimate of (P(Xi= c|y) known apriori m: hyper-parameter for our confidence in p original: ? ??= ? ?) =?? ? Laplace Estimate: ? ??= ? ?) =??+ 1 ? + ? m estimate: ? ??= ? ?) =??+ ?? ? + ? 2/08/2021 Introduction to Data Mining, 2nd Edition 17
Example of Nave Bayes Classifier Name Give Birth yes no no yes no no yes no yes Can Fly no no no no no no yes yes no no no no no no no no no yes no yes Live in Water Have Legs no no yes yes sometimes yes no no no no yes sometimes yes sometimes yes no yes sometimes yes no no no yes no Class A: attributes human python salmon whale frog komodo bat pigeon cat leopard shark yes turtle penguin porcupine eel salamander gila monster platypus owl dolphin eagle yes no no no mammals non-mammals non-mammals mammals non-mammals non-mammals mammals non-mammals mammals non-mammals non-mammals non-mammals mammals non-mammals non-mammals non-mammals mammals non-mammals mammals non-mammals M: mammals N: non-mammals 6 6 2 2 yes yes yes yes no = = ( | ) . 0 06 P A M 7 7 7 7 1 10 3 4 = = ( | ) . 0 0042 P A N no no yes no no no no no yes no 13 13 13 13 yes no 7 = = ( | ) ( ) . 0 06 . 0 021 P A M P M 20 yes yes yes no yes 13 = = ( | ) ( ) . 0 004 . 0 0027 P A N P N 20 P(A|M)P(M) > P(A|N)P(N) Give Birth yes Can Fly no Live in Water Have Legs yes Class no ? => Mammals 2/08/2021 Introduction to Data Mining, 2nd Edition 18
Nave Bayes (Summary) Robust to isolated noise points Handle missing values by ignoring the instance during probability estimate calculations Robust to irrelevant attributes Redundant and correlated attributes will violate class conditional assumption Use other techniques such as Bayesian Belief Networks (BBN) 2/08/2021 Introduction to Data Mining, 2nd Edition 19
Nave Bayes How does Na ve Bayes perform on the following dataset? Conditional independence of attributes is violated 2/08/2021 Introduction to Data Mining, 2nd Edition 20
Bayesian Belief Networks Provides graphical representation of probabilistic relationships among a set of random variables Consists of: A directed acyclic graph (dag) Node corresponds to a variable Arc corresponds to dependence relationship between a pair of variables A B C A probability table associating each node to its immediate parent 2/08/2021 Introduction to Data Mining, 2nd Edition 21
Conditional Independence D D is parent of C A is child of C C B is descendant of D D is ancestor of A B A A node in a Bayesian network is conditionally independent of all of its nondescendants, if its parents are known 2/08/2021 Introduction to Data Mining, 2nd Edition 22
Conditional Independence Na ve Bayes assumption: y ... Xd X1 X2 X3 X4 2/08/2021 Introduction to Data Mining, 2nd Edition 23
Probability Tables If X does not have any parents, table contains prior probability P(X) Y If X has only one parent (Y), table contains conditional probability P(X|Y) X If X has multiple parents (Y1, Y2, , Yk), table contains conditional probability P(X|Y1, Y2, , Yk) 2/08/2021 Introduction to Data Mining, 2nd Edition 24
Example of Bayesian Belief Network Diet=Healthy Diet=Unhealthy 0.25 0.75 Exercise=Yes Exercise=No 0.7 0.3 Exercise Diet D=Healthy E=Yes D=Healthy E=No D=Unhealthy E=Yes D=Unhealthy E=No Heart Disease HD=Yes HD=No 0.25 0.75 0.45 0.55 0.55 0.45 0.75 0.25 Blood Pressure Chest Pain HD=Yes HD=No 0.85 0.15 BP=High BP=Low HD=Yes HD=No 0.8 0.2 CP=Yes CP=No 0.2 0.8 0.01 0.99 2/08/2021 Introduction to Data Mining, 2nd Edition 25
Example of Inferencing using BBN Given: X = (E=No, D=Yes, CP=Yes, BP=High) Compute P(HD|E,D,CP,BP)? P(HD=Yes| E=No,D=Yes) = 0.55 P(CP=Yes| HD=Yes) = 0.8 P(BP=High| HD=Yes) = 0.85 P(HD=Yes|E=No,D=Yes,CP=Yes,BP=High) 0.55 0.8 0.85 = 0.374 Classify X as Yes P(HD=No| E=No,D=Yes) = 0.45 P(CP=Yes| HD=No) = 0.01 P(BP=High| HD=No) = 0.2 P(HD=No|E=No,D=Yes,CP=Yes,BP=High) 0.45 0.01 0.2 = 0.0009 2/08/2021 Introduction to Data Mining, 2nd Edition 26

