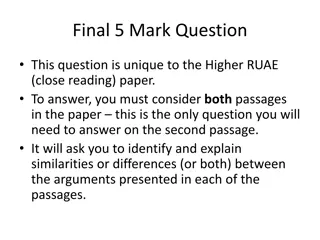
Intergroup Agreement and Disagreement Measures in Biostatistics
This presentation by Madhusmita Panda, an Associate Biostatistician at Cytel, discusses the importance of measuring intergroup agreement and disagreement in statistical analysis. The content covers various measures available in literature, intuitive approaches for measurement, and includes a hypothetical scenario to illustrate these concepts. It emphasizes the significance of agreement in rating patterns by different raters and provides examples of agreement measures such as Cohen's kappa and Krippendorff's alpha. Additionally, consensus agreement measures are explored, along with practical applications in evaluating diagnostic tests and assessing reliability of scales.

Download Presentation

Please find below an Image/Link to download the presentation.
The content on the website is provided AS IS for your information and personal use only. It may not be sold, licensed, or shared on other websites without obtaining consent from the author.If you encounter any issues during the download, it is possible that the publisher has removed the file from their server.
You are allowed to download the files provided on this website for personal or commercial use, subject to the condition that they are used lawfully. All files are the property of their respective owners.
The content on the website is provided AS IS for your information and personal use only. It may not be sold, licensed, or shared on other websites without obtaining consent from the author.
E N D
Presentation Transcript
Measuring Intergroup Agreement and Disagreement Madhusmita Panda Associate Biostatistician, Cytel PSI 2017, London
Overview Agreement and Correlation Measures available in literature Intuitive ways of measuring intergroup agreement Comparing different measures Remarks Future work Madhusmita Panda, Cytel, PSI 2017 2
Why Agreement? Agreement: Closeness of rating patterns by different raters Application: Between old and new diagnostic tests Group of assessors testing reliability of scales Group of expert & na ve assessors Correlation and Agreement Measures similarity in rating patterns Subject Rater 1 Rater 2 1 1 2 2 1 2 3 2 3 Rater 1 always gives a lower rank than Rater 2 Correlation = 1 but no Agreement Madhusmita Panda, Cytel, PSI 2017 3
Measures Available in Literature # Raters Quantitative data Qualitative data Cohen's appa, Weighted Cohen s kappa 2 Raters Bland Altman plot > 2 Raters Krippendorff's alpha Fleiss appa Two Groups of Raters Based on Spearman rank correlation Vanbelle, S (2009) Problem of Interest Measure for inter-group agreement Applicable for all types of data Madhusmita Panda, Cytel, PSI 2017 4
Hypothetical Scenario 2 Groups Group A 3 Raters Group B 4 Raters 2 Subjects 3 point ordinal scale (3 High, 2 Medium, 1 Low) Data Group A A1 A2 1 2 Group B B2 1 1 Sid 1 2 A3 2 2 B1 3 2 B3 1 1 B4 2 1 1 1 Madhusmita Panda, Cytel, PSI 2017 5
Intuitive Approaches Available in Literature Madhusmita Panda, Cytel, PSI 2017 6
Consensus Agreement Measure Ref: van Hoeij et al., 2004, Raine et al., 2004 Group A Group B Sid A B Mode Sid A1 A2 A3 B1 B2 B3 B4 1 1 1 1 1 1 1 1 2 3 1 1 2 Sid A B Median 2 2 1 2 2 1 1 1 2 2 1 1 2 Weighted Cohen s kappa Proportion Agreement Measure Ref: Hartmann, 1977 Cases # of agreement Proportion Agreement (PA) = = Total Cases # Group A Group B #Case of Agreement = 10 Sid A1 A2 A3 B1 B2 B3 B4 10 PA = = = = 0.42 24 1 1 1 2 3 1 1 2 Total #cases = 3*4*2 = 24 2 2 1 2 2 1 1 1 7 Madhusmita Panda, Cytel, PSI 2017
Intuitive Extension of Cohen s kappa & Weighted Cohen s kappa Madhusmita Panda, Cytel, PSI 2017 8
Pair-wise Agreement For each pair calculate agreement using Weighted Cohen s kappa Group A 3 raters Group B 4 raters 12 Pairs Average 12 kappa values Pooled-data Agreement Disregarding individual raters in each group and pooling the ratings Calculate single agreement value using Weighted Cohen s kappa Group A 3 raters Group B 4 raters 1 kappa value Madhusmita Panda, Cytel, PSI 2017 9
Intuitive Extension of Fleiss kappa & Krippendorff's alpha Madhusmita Panda, Cytel, PSI 2017 10
Cube Root of Product Measure (CRPm) Calculate three values of Agreement measure:- Agr(A), Agr(B), Agr(A B) Agreement measure used Fleiss kappa (Nominal data) Krippendorff's alpha (quantitative or ordinal data) Proposed Measure: 3 = = CRPm Agr (A)* Agr (B)* Agr ( A B ) Each factor between -1 to 1 => CRPm is between -1 & 1. CRPm is high if all three factors are high. Applicable for all types of data. Madhusmita Panda, Cytel, PSI 2017 11
Proposed Measure based on Disagreement Madhusmita Panda, Cytel, PSI 2017 12
Disagreement Measure (Dm) Data Structure: where, i = 1, 2, . . . , m1 (#Group A raters) j = 1, 2, . . . , m2 (#Group B raters) k= 1, 2, . . . , n (#Subjects) Xjk= [A1k Bjk, A2k Bjk, . . . , Am1k Bjk] Ex: For subject 1, Rater B1 & 3 Group A raters X11 = [ A11 B11, A21 B11, A31 B11] = [1 3, 1 3, 2 3] X11 = [-2, -2, -1] #Vectors = #Raters in group B * #Subjects = m2 * n = 4*2 = 8 Extent of disagreement: Qjk = Xjk *S-1*Xjk ' 1 Property of quadratic form: X * S * X 1 ' X * X Madhusmita Panda, Cytel, PSI 2017 13
Disagreement Measure (Dm) Continued . Proposed measure of disagreement ' jk 1 m n X * S ' jk * X 2 jk = = k ( m * n ) 2 X X = = j 1 1 jk = = Dm 1 Dm lies between 0 and 1. Applicable for ordinal and quantitative data Proposed Agreement Measure Am = 1 - Dm Madhusmita Panda, Cytel, PSI 2017 14
Comparing Measures Using Hypothetical Qualitative Data Group1 Medical students (3) Group2 Expert psychiatrists (3) 20 patients Question to raters: Give one of possibly five diagnoses to each patient. Diagnosis indicates stages of sickness Madhusmita Panda, Cytel, PSI 2017 15
Results using Jackknife Re-sampling Jackknife Statistics Agreement Value Method Mean SE 0.964 0.955 0.018 Agreement Measure Am(1 Dm) 0.722 0.722 0.057 Proportion Agreement Measure 0.817 0.844 0.077 Vanbelle's Generalized Measure 0.891 0.913 0.091 Consensus (Median) Measure 0.706 0.741 0.101 Pooled Agreement Measure 0.702 0.739 0.106 Pair-wise Agreement Measure 0.777 0.807 0.108 Cube Root of Product Measure 0.850 0.921 0.176 Consensus (Mode) Measure Madhusmita Panda, Cytel, PSI 2017 16
Remarks Am (1 Dm) : Lowest SE Applicable for ordinal and quantitative Proportion Agreement Measure : Treats Nominal and ordinal data similarly Does not take into account the agreement due solely by chance Vanbelle s Generalised Measure: Higher SE than Am & Proportion agreement Applicable for qualitative data Consensus (Median) Measure : Higher SE than above 3 measures Applicable for qualitative data Madhusmita Panda, Cytel, PSI 2017 17
Future Work Comparing measures on quantitative data Checking properties of these measures Madhusmita Panda, Cytel, PSI 2017 18
Thank You madhusmita.panda@cytel.com


")

")
")