Integrating Pedestrians and Bicycles at Signalized Intersections - NCHRP Report Insights
Explore the comprehensive study on traffic signal design and operations for non-motorized users at signalized intersections. The report dives into the state of practice, research opportunities, industry gaps, knowledge imbalance, challenges, and the need for tailored solutions in varied environments.

Download Presentation

Please find below an Image/Link to download the presentation.
The content on the website is provided AS IS for your information and personal use only. It may not be sold, licensed, or shared on other websites without obtaining consent from the author.If you encounter any issues during the download, it is possible that the publisher has removed the file from their server.
You are allowed to download the files provided on this website for personal or commercial use, subject to the condition that they are used lawfully. All files are the property of their respective owners.
The content on the website is provided AS IS for your information and personal use only. It may not be sold, licensed, or shared on other websites without obtaining consent from the author.
E N D
Presentation Transcript
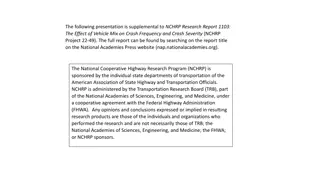
Integrating Pedestrians and Bicycles at Signalized Intersections NCHRP 03-133: Traffic Signal Design and Operations Strategies for Non-Motorized Users
NCHRP 03-133: Traffic Signal Design and Operations Strategies for Non-Motorized Users Synthesize state of practice Identify and fill information gaps Develop a guide to help plan/design/operate for non-motorized users
NCHRP 03-133: Toolbox Guidance on traffic signal design and operations strategies for non-motorized users in signalized intersections; and Conceptual framework and set of training materials for practitioners
Research Opportunities / Questions What is the state of practice Who is the audience? Where is the bar ? Why do people care? What is the actual need?
Industry Gaps Source: NCHRP Report 812: Signal Timing Manual, Second Edition
Knowledge Imbalance Auto Highway Capacity Manual Non-Motorized Sidewalks AASHTO Green Book Americans with Disabilities Act (ADA) 1990 Highway Safety Manual Public Rights-of-Way Accessibility Guidelines (PROWAG) MUTCD Connected/Autonomous Vehicles Level of Traffic Stress (LTS) Alternative Intersections NACTO Simulation and modeling and much more .
State of Practice Many unknowns Misinformation Myths Fear Barriers Knowledge base for segments is further along than at intersections Seeing is believing Suite of available treatments Still learning about context and performance
Challenges Varying perspectives Impact Value Priority Wide range of environment Urban Suburban Rural
One Size Fits All Connect to agency capabilities Policies Staff support Maintenance Context More context And .more context?
Agency Perspectives Proactive and Forward Thinking Innovators and Early Adopters Willingness to implement treatments with best intentions Interested and Cautious Early Majority Open to test/pilot treatments to learn more Status Quo Minimum requirements Not a priority
Multifaceted Needs Project level implementations Countermeasures Engineering studies Reactive approach Planning implementations Policy supported and driven Planning studies Proactive approach Range of applications
Common Project Experiences Countermeasures Vision Zero Spot improvements Corridor project Planning level analysis not meeting engineering expectations Design exceptions Policies Technologies
Integrated System Operations Goals and Objectives Mobility Safety Design Physical infrastructure and control Equipment Performance monitoring and management
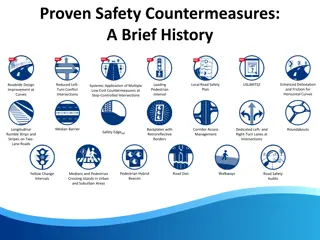
Treatments Numerous unique treatments identified Broad categorization with similar outcomes SET 1: Reduce Pedestrian Delay SET 2: Eliminating Conflicts with Parallel Turns SET 3: Mitigating Conflicts with Parallel Turns SET 4: Improving Ped/Bike Information and Ease SET 5: Bicycle Phases and Special Bike Needs SET 6: Special Timing Techniques
SET 1: Basic Treatments to Reduce Pedestrian Delay Evaluating Pedestrian and Bicycle Delay Short Cycle Length Maximizing Walk Interval Length Recall versus Actuation for Pedestrians 16
Basic Treatments to Reduce Pedestrian Delay Evaluating Pedestrian and Bicycle Crossing Delay Boston Example Timing Plan 1: 123 s average ped delay Timing Plan 2: 45 s average ped delay (with 0.5 s increase in vehicular delay) Policy: Whenever vehicular delay is reported, ped delay must be reported, too. Only what s measured counts 17
SET 2: Eliminating Conflicts with Parallel Traffic Turns Exclusive Pedestrian Phases Protected Left Turns on Multilane Roads Concurrent-Protected Pedestrian Crossings Delta Islands (Channelized Right Turns) for Ped and Bike Crossings 18
Eliminating Conflicts with Parallel Traffic Turns Protected Left Turns on Multilane Roads Amsterdam Policy: On multilane roads, left turns are protected only, never permitted . 1 2 US Guidelines: Permitted lefts are OK unless: 50+ mph speed limit Crossing 4+ lanes Crash experience o Contrary to Vision Zero principles 3 19
SET 3: Mitigating Conflicts with Parallel Traffic Turns Leading Pedestrian Intervals Delayed Turn / Leading Through Intervals Flashing Ped/Bike Crossing Warning 20
Mitigating Conflicts with Parallel Traffic Turns Delayed Turn a.k.a. Leading Bike Interval, Leading Thru Interval, LPI+ Leading interval (10 s or more) Charlotte ( LPI-Plus ) New York, Charlotte: Only with a right turn lane Montreal: Without a right turn lane 21
SET 4: Improving Ped/Bike Information and Ease Pedestrian Countdown Bike Wait Countdown No Turn on Red Independently Mounted Pushbuttons Accessible Signals without Pushbuttons Call Indicators Serving Slower Pedestrians 22
SET 5: Bicycle Phases and Special Bike Needs Indicating Bike Phases Detection for Bicycles Minimum Green and Safety-Based Green Extension for Bikes with Shared Traffic Signals 23
SET 6: Special Phasing Techniques Favoring Pedestrians and Bikes Multi-Stage Crossings - Pointer to all the Treatments that Relate to Multi- Stage Crossings Pedestrian Phase Overlaps with Each Other, with Bike Phases, and with Vehicular Holds Re-service for the Ped/Bike Phase Two-Stage Left Turn Progression for Bikes Pedestrian Hybrid Beacon Signals at Intersections with Minor Streets 24
Special Phasing Techniques Favoring Peds and Bikes Re-service for the Ped/Bike Phase Reservice: twice per cycle Run free: on demand, allowing cars 10 s green between ped phases 25
Treatment Fundamentals Documentation/expansion of knowledge base Consistent set of information (pending if available) Identification of additional treatment locations and application examples, Illustration of signal timing phasing strategy variations, Graphics to simplify concepts (geometry, phasing) Accessibility considerations Controller settings and parameters Documentation of additional case studies, papers, and/or agency practices, and Expansion of defining context and operating environment. Support for maintenance and operations 26
Which Pedestrian Mode Should You Use? Pedestrian Recall vs Actuation: Preliminary Findings
Pedestrian Recall vs. Actuation Research Need Vehicle Green Time Need Pedestrian Volume Decision Pedestrian volume Short Medium Long Low Low Actuation Actuation ? Recall Medium High High ? Recall Recall ? Recall Recall Recall Medium ? Decision involves a tradeoff between Impact on operations (traffic delay, capacity, progression, cycle length) Impact on pedestrians (delay, compliance/safety)
Research Questions What impacts occur when putting ped phases on recall? Is there a ped volume threshold to set ped phases on recall? How is it different for peds crossing major street or side street?
Research Methodology: Base Model Microsimulation on a real arterial in Virginia (Route 1) Coordinated-actuated arterial with 110 seconds cycle length Focusing on a single (test) intersection that is non- critical (i.e., has slack capacity) Modeled both peds crossing main arterial and side street Recall was tested only for peds crossing main arterial (7 sec of Walk and 20 sec of FDW) Crosswalk across side street was set to Rest in Walk
Research Methodology: Variables Probability of pedestrian demand in a given cycle (denoted as PP ) Side street vehicle green time required as a fraction of Min Ped Green time required (denoted as SSG ) 0.5 0.1 (4 peds/hr) 0.3 (12 peds/hr) 0.6 0.5 (24 peds/hr) 0.7 0.7 (42 peds/hr) 0.85 0.9 (80 peds/hr) 1.0 1.2
Research Methodology: Scenarios and Considerations Measure delays comparing pedestrian recall modes against variables Adjustments for probability of pedestrians wanting to cross Adjustments for side street vehicular demand relative to green time Considerations for turning movement volumes Coordinated signal timing factors
Preliminary Results: Delay Change for Peds Crossing the Main Arterial 0.0 With small PP, delay change is nearly equal to Walk time -1.0 -2.0 Delay Change (sec) -3.0 With high PP, almost no change since ped actuation functions like a recall -4.0 -5.0 -6.0 -7.0 -8.0 0.0 0.1 0.2 0.3 0.4 0.5 0.6 0.7 0.8 0.9 1.0 Pedestrian Probability (PP)
Preliminary Results: Delay Change for Peds Crossing the Side Street 8.0 SSG=0.5, PP=0.1 Scenario SSG=0.5 With high SSG, regardless of ped volume, impact is small 7.0 SSG=0.6 Peds Crossing Main Arterial Peds Crossing Side Street 6.0 SSG=0.7 Delay Change (sec) SSG=0.85 -7 seconds 59 seconds to 52 seconds +5 seconds 8 seconds to 13 seconds 5.0 SSG=1.0 4.0 SSG=1.2 3.0 2.0 1.0 0.0 0.0 0.1 0.2 0.3 0.4 0.5 0.6 0.7 0.8 0.9 1.0 Pedestrian Probability (PP)
Preliminary Results: Intersection Vehicle Delay With low PP and SSG, more pronounced impact but still less than 3 seconds 8.0 SSG=0.5 7.0 SSG=0.6 With high SSG, almost no impact on intersection delay 6.0 SSG=0.7 Delay Change (sec) 5.0 SSG=0.85 SSG=1.0 4.0 SSG=1.2 3.0 2.0 1.0 0.0 -1.0 0.0 0.1 0.2 0.3 0.4 0.5 0.6 0.7 0.8 0.9 1.0 Pedestrian Probability (PP)
Key Findings High pedestrian demand: Pedestrian recall is appropriate and has no impact on intersection delay Long side street vehicular phase green time required: Regardless of pedestrian demand, pedestrian recall will reduce pedestrian delay with almost no impact on intersection delay Low pedestrian volumes: Pedestrian recall will reduce ped delay by about the same duration of the Walk interval.
Look Ahead: Define Practice Linking needs and policies to decision making Highlighting context and users Proactive planning Project support Integrated operations
Filling in Gaps Supporting Outcome Based Approach Considerations Utilizing the Toolbox Toolbox Reference and guidance Stand Alone Treatment information sheets Performance Management Monitoring and measuring
Key Takeaways Integrate not accommodate Considerations for context and priorities Change the status quo