Integrating Geographic Data with BI Dashboards for Strategic Insights
Explore the transformative potential of integrating geographic data into BI dashboard tool for strategic insights in our latest blog. Dive deep into the processu2014from defining precise objectives and meticulous data collection to expert dashboard

Download Presentation

Please find below an Image/Link to download the presentation.
The content on the website is provided AS IS for your information and personal use only. It may not be sold, licensed, or shared on other websites without obtaining consent from the author. Download presentation by click this link. If you encounter any issues during the download, it is possible that the publisher has removed the file from their server.
E N D
Presentation Transcript
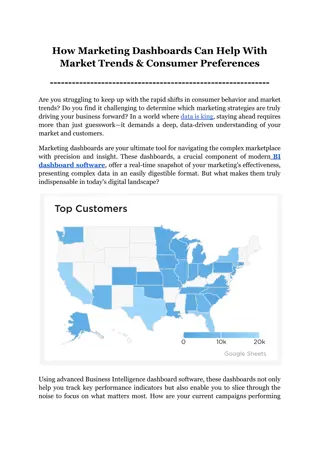
Integrating Geographic Data with BI Dashboards for Strategic Insights The Importance of Geographic Insights in Business Intelligence 1. Enhancing Market Understanding Geographic data allows companies to visualize market trends and consumer behavior across different regions. Using the best BI dashboard tool, businesses can segment data by location to identify which areas are underperforming or outperforming. For instance, a retail chain could use geographic insights to see that while their urban stores are performing well, rural areas are lagging, prompting targeted marketing campaigns or adjusted inventory levels. According to a report by Mordor Intelligence, the location analytics market size is expected to reach USD 22.8 billion by 2026, growing at a CAGR of 13.2% from 2021 to 2026, stating the increasing reliance on geographic data in strategic planning. 2. Optimizing Resource Distribution Effective resource distribution is crucial for maximizing ROI, and here geographic insights integrated into BI (Business Intelligence) software prove invaluable. Logistics companies, for example, can analyze route efficiencies and distribution centers' locations to minimize delivery times and reduce costs. A study by Esri reveals that companies implementing geographic information systems (GIS) can see a 5-25% improvement in operational efficiency. 3. Tailoring Products and Services Understanding regional preferences and cultural nuances is essential for product and service customization. The best business intelligence dashboards allow companies to drill down into demographic and geographic data to tailor offerings accordingly. A BI tool could reveal that customers in colder climates prefer warm beverages throughout the year, prompting a coffee shop chain to adjust their seasonal menu by region to boost sales.
4. Risk Management Geographic data is critical in assessing and mitigating risks, particularly in industries like insurance and real estate. The best BI dashboard tool can overlay environmental data, such as flood plains or earthquake zones, with business locations to assess risk levels. Insurers can set premiums more accurately and property developers can make informed decisions about where to build or invest. 5. Competitive Analysis By using geographic insights, businesses can also monitor competitors' activities across different regions. BI (Business Intelligence) software can help identify areas with high competitor saturation, areas underserved by the industry, and potential for expansion. This strategic use of geographic data helps companies stay one step ahead in a competitive market. 6. Regulatory Compliance
For businesses operating in multiple regions, compliance with local laws and regulations is simplified through geographic insights. The best BI dashboard tools can help track and manage region-specific compliance requirements, reducing the risk of penalties and legal issues. For example, a multinational corporation could use BI tools to monitor environmental compliance across different countries. Step-by-Step Guide to Setting Up Geographic Dashboards Creating a geographic dashboard using a BI dashboard tool is a strategic approach to visualizing and analyzing data that is location-specific, offering profound insights into various aspects of business operations from sales to distribution. Step 1: Define Your Geographic Data Objectives When embarking on the journey of integrating a geographic dashboard within your business intelligence framework, setting clear, actionable objectives is paramount. This foundational step is not just about harnessing data; it s about strategically aligning it with your core business aspirations, ensuring that every insight extracted is of intrinsic value. Determining your company's use of geographic intelligence is the first step in implementing the best BI dashboard tool. Does it pertain to optimizing logistics, enhancing customer service, or identifying new market opportunities? Your objectives should mirror the complex tapestry of location-based threads of data. business needs, woven with precise, Market Penetration: For businesses looking to expand, geographic data can delineate regions of high customer density or areas underserved by competitors. A study by Forbes highlights that companies using spatial data for market analysis see a 15-20% increase in market reach. Resource Allocation: Whether it s deploying field personnel or positioning inventory, geographic objectives can drastically streamline operations. Utilizing a BI (Business Intelligence) software that incorporates real-time geographic data ensures resources are always optimally aligned with demand. Risk Mitigation: In industries like insurance or real estate, geographic data can forecast potential risk areas for natural disasters, aiding in crafting preemptive strategies. Incorporating this into the best business intelligence dashboards allows for a dynamic risk assessment model that adapts to new data seamlessly.
With a clear understanding of the types of insights geographic data can provide, the next step is crafting specific, measurable objectives that resonate with your strategic goals. This is where the granularity of a BI dashboard tool becomes invaluable. Consider the following approaches: Quantitative Objectives: These might include specific metrics like reducing delivery times by 10% in key regions or increasing market share by 5% in new geographic markets by using insights derived from the best BI dashboard tool. Qualitative Objectives: These could focus on improving customer satisfaction scores in specific areas or enhancing brand visibility in untapped markets. Even though these are less about numbers, the right BI (Business Intelligence) software can track and analyze sentiment and visibility through geographic tagging and data analysis. Timeline-Based Objectives: Set deadlines for achieving geographic insights milestones. For instance, understanding market dynamics within a new region within six months post-launch of a new product. Determine the granularity of geographic information required to support your objectives. This involves deciding whether data should be analyzed by zip code, city, state, or region. The level of detail will affect both the type of data you collect and the insights
you can extract. More granular data provides deeper insights but may require more sophisticated tools and analysis techniques. Step 2: Collect and Prepare Your Geographic Data Collecting geographic data involves tapping into a diverse array of sources, each offering unique perspectives and insights. The aim here is not just to gather data, but to capture a comprehensive geographical narrative that enhances decision-making. Satellite Imagery and Aerial Photography: These provide a bird s-eye view of large geographic areas, offering updates development, and environmental shifts. Sensors and IoT Devices: Deployed across various locations, these devices provide real-time data on traffic patterns, weather conditions, and more, feeding into the best BI dashboard tools for immediate analysis. Public and Commercial Databases: From government land records to commercial location databases, these sources are foundational for demographic and economic analysis. User-Generated Content: Social media and mobile apps offer crowdsourced geographic data that can reflect real-time events, trends, and movements. on land use changes, urban A report by MarketsandMarkets estimated that the geospatial analytics market would grow to $96.34 billion by 2025, highlighting the expanding landscape of data sources crucial for geographic analyses. Once data is collected, the preparation stage is about transforming raw data into a refined, dashboard-ready format. This involves a series of technical and analytical steps designed to ensure compatibility with BI business intelligence software. Data Cleaning: Remove inaccuracies and inconsistencies such as duplicates, incorrect entries, and missing values. Data Integration: Standardize data formats to ensure seamless integration into the best BI dashboard tools. This might involve converting data into common geographic data formats like Shapefiles or GeoJSON. Geocoding: Convert addresses into geographic coordinates. This is vital for plotting data points on maps within BI tools accurately. Data Enrichment: Augment data with additional layers of information like adding population density or economic activity indicators to enhance the data s analytical value. A survey by Gartner indicated that organizations believe poor data quality to be responsible for an average of $15 million per year in losses, underscoring the
importance of meticulous data preparation. To facilitate the collection and preparation of geographic data, leveraging advanced tools and technologies is non-negotiable. The best BI dashboard tool not only integrates data but also assists in its refinement and preparation. Step 4: Set Up the Dashboard Setting up a geographic dashboard using a BI dashboard tool involves more than just loading data; it requires a careful orchestration of design, functionality, and analytics to ensure the dashboard not only displays data but also transforms it into actionable insights. This step is important for business users, data analysts, and entrepreneurs who rely on the best business intelligence dashboards to make informed decisions. Here s a detailed exploration of how to set up a dashboard that leverages the full capabilities of BI (Business Intelligence) software, ensuring each component is optimized for maximum impact. Designing for Clarity and Impact The design of your dashboard is the first thing users will notice, and it can greatly affect their ability to understand and use the geographic data effectively. The best BI dashboard tools provide robust customization options to help tailor the dashboard to specific business needs. Layout Planning: Start with a layout that logically organizes information, grouping related data visually. A well-thought-out layout helps users intuitively navigate through data and derive insights faster. Visualization Selection: Choose visualizations that best represent geographic data, such as heat maps for density, line maps for movements, or bubble maps for displaying data points with varying sizes. Each visualization should enhance the understanding of the dataset, revealing patterns that raw data alone cannot. Interactivity: Incorporate interactive elements such as filters, hover-over details, and drill-down capabilities. These features allow users to engage with the data dynamically, exploring different layers of the data without overwhelming the initial view. A well-implemented dashboards and BI tools increase their decision-making speed. survey by MicroStrategy revealed that 84% of business users say that Integrating Data with Precision
The integration phase is critical as it involves populating the dashboard with accurate and up-to-date data. This step must be executed with precision to ensure the reliability of the insights generated. Data Connectivity: Utilize the data connectors provided by your BI business intelligence software to link data sources directly to the dashboard. This ensures data freshness and reduces manual data handling errors. Data Synchronization: Set up synchronization settings to refresh data at required intervals. Real-time data synchronization is crucial for applications like tracking logistics or monitoring live operational data. Quality Checks: Implement automated checks to validate data as it enters the dashboard. This preemptive approach to data quality can mitigate issues that might distort analytical outcomes. Customization for Deeper Insights To truly leverage the best BI dashboard tool, customization is key. This involves tailoring the dashboard not only to the needs of the business but also to the preferences of its users. Custom Metrics and KPIs: Define and integrate custom KPIs that are relevant to your geographic analysis. Whether it s tracking sales performance across regions or monitoring delivery times, these KPIs should reflect the strategic goals of the business. User-Specific Views: Create multiple dashboard views tailored to different user roles. For instance, a strategic view for executives with high-level metrics and a more detailed operational view for managers.
Testing and Feedback Loop Before the full rollout, it s essential to conduct thorough testing and gather user feedback. This iterative process helps refine the dashboard for optimal usability and effectiveness. User Testing: Involve a group of end-users in the testing phase to use the dashboard in real scenarios. Their feedback can provide invaluable insights into usability issues or additional needs.
Feedback feedback to ensure the dashboard meets the practical needs of its users. Implementation: Quickly implement changes based on user Step 5: Test and Optimize The final and arguably most crucial step in leveraging a BI dashboard tool is the iterative process of testing and optimizing the dashboard. This phase is designed to ensure that the dashboard not only functions as intended but also aligns perfectly with the user requirements and business objectives. For business users, data analysts, and entrepreneurs, this means rigorously scrutinizing the best business intelligence dashboards to ensure they deliver actionable insights with precision and efficiency. Rigorous Testing for Robust Performance Testing is the first line of defense against potential inefficiencies and inaccuracies in your BI (Business Intelligence) software. This phase involves several key activities: Functional Testing: Verify that all features of the dashboard work as expected. This includes testing data loading times, interactive elements, and visualization accuracy. Functional testing helps identify any technical glitches that could impair the user experience. User Acceptance Testing (UAT): This is conducted with actual users to ensure the dashboard meets their needs and expectations. UAT can reveal insights into user interaction patterns and potential improvements that might not be evident to developers or analysts. Performance Testing: Assess how well the BI dashboard tool performs under various data loads and user numbers. According to a survey by Tableau, 70% of businesses report increased user adoption after optimizing their dashboards for performance. Optimization: Tailoring for Excellence Following testing, optimization is essential to refine and enhance the dashboard s functionality and user interface. This includes: Data Refresh Optimization: Ensure that the dashboard refreshes its data efficiently without lagging, especially if it's meant to display real-time data. Optimizing data refresh rates can significantly improve decision-making speed. Visualization Refinement: Based on user feedback, refine the visual elements of the dashboard to ensure they are intuitive and effectively communicate the intended insights. For example, simplifying a complex map or adding explanatory tooltips can enhance user understanding and interaction.
Customization Enhancements: Tailor the dashboard further to meet specific user roles or preferences. This might involve creating personalized views or adding customizable widgets that allow users to manipulate data dynamically. Feedback Integration: A Continuous Loop Optimizing a BI dashboard is not a one-time task but a continuous improvement process that depends heavily on user feedback: Iterative Feedback Collection: Establish mechanisms for ongoing feedback collection, such as regular reviews with users or automated feedback tools integrated within the dashboard. Agile Implementation: Adopt an agile approach to quickly implement changes and enhancements based on feedback. This ensures that the dashboard evolves in line with user needs and business dynamics. Training and Support: Continually offer training and support to users to help them make the most of the dashboard s capabilities. According to Gartner, ongoing training can increase BI tool utilization by up to 40%. Step 6: Training and Deployment The culmination of developing a geographic dashboard using a BI dashboard tool is its deployment across your organization and the training of your team to leverage this
powerful resource. This stage is critical not just for ensuring a smooth transition but for empowering your users to harness the full potential of the best business intelligence dashboards. The objective is to make the transition from a static data environment to a dynamic, insight-driven one that facilitates better decisions at every level of the organization. Deployment: Seamless Integration into Daily Operations Deployment involves more than simply making a new tool available. It's about integrating the best BI dashboard tool into the existing technological ecosystem and workflows in a manner that is both seamless and impactful. Staged Rollout: Rather than an all-encompassing launch, consider a staged rollout. Start with a pilot group that can provide insights into potential hiccups before a full-scale implementation. System Integration: Ensure that the BI dashboard tool integrates smoothly with other systems and platforms in use. This may require some backend adjustments or middleware development to ensure that data flows are uninterrupted and secure. Access Management: Set up clear protocols for access management, ensuring that every user has rights that align with their roles and responsibilities. This step is crucial to maintain data integrity and security. Training: Cultivating Proficiency Training is a vital component that determines how well your team can utilize the BI (Business Intelligence) software. Effective training programs are tailored to the specific needs of the users, from novices to seasoned analysts. Role-Specific Modules: Develop training modules that are customized to the roles of the users. Sales personnel might require training on accessing and interpreting sales performance metrics, while senior management might need to understand how to view high-level strategic reports. Interactive Learning: Utilize interactive sessions, including hands-on workshops where users can practice with real data sets. According to a LinkedIn report, employees trained with active learning techniques are 75% more likely to apply learned skills in their jobs. Continuous Learning: Establish ongoing learning and development programs to keep up with updates to the BI software and evolving business needs. This approach helps in sustaining user engagement and software utilization. Ensuring Successful Deployment
Deployment success is measured not just by software functionality but by its adoption across the organization and the value it adds to business operations. Feedback experiences and difficulties encountered with the dashboard. This insight is invaluable for refining tool capabilities and user interfaces. Support Systems: Set up a robust support system to assist users with technical issues and queries. Quick resolution of problems increases user satisfaction and engagement with the tool. Impact Measurement: Establish metrics to evaluate the impact of the dashboard on business operations. This could include time saved in report generation, increased accuracy in data-driven decisions, or improved user productivity. Loops: Implement regular feedback loops to capture user Conclusion The integration of geographic data into BI dashboards represents a transformative leap forward in how businesses harness the power of spatial information to make strategic decisions. Through the detailed steps outlined from defining objectives and collecting data to deployment and ongoing optimization companies can uncover hidden patterns, optimize operations, and outmaneuver competition in ways previously unimagined. As we have explored, the capabilities of the best BI dashboard tools extend far beyond mere data visualization. They empower organizations to interpret complex geographic datasets in real-time, ensuring that every decision is informed by up-to-date, accurate, and relevant information. This ability to dynamically interact with geographic data can redefine market strategies, enhance customer engagement, and streamline operations across multiple locations. For those seeking to embark on this journey, selecting the right BI tool is crucial. Grow, with its intuitive interface and robust functionality, stands out as a leading choice for integrating geographic data into business intelligence. Grow's platform is designed not just for data analysts but for any business user desiring to leverage deep insights to drive strategic actions. We encourage you to explore how Grow can transform your business intelligence capabilities by signing up for a 14-day free trial. Experience firsthand how integrating geographic data with Grow s advanced BI tools can enhance your strategic decision-making processes. For more insights into the benefits and user experiences with Grow, consider reading through Grow.com Reviews & Product Details on G2. Here, you ll find
comprehensive reviews that underscore the effectiveness and impact of Grow's BI solutions in various industries. Embrace the potential of geographic data with Grow, and start making more informed, location-smart decisions today. Original Source: https://bit.ly/3TdjxhJ