Insights on Leisure Time Allocation in America


How Americans Allocate Their
Leisure Time
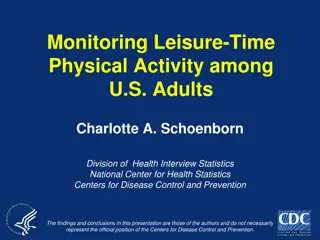
According to the US Bureau of Labor Statistics’
American Time Use Survey for 2016, employed adults
with no children younger than 18 in the household spent
4.5 hours/day on leisure activities; employed adults
living with a child younger than 6 spent 3.3 hours.
For all persons, 15 years of age and older, men’s time
for leisure activities decreased from 5.9 hours for 2013
to 5.5 hours for 2016. Women also had less time for
leisure activities during 2016 (4.8 hours) compared to
2013 (5.2 hours).
Television viewing continued to be the #1 leisure
activities in terms of time spent, at 2.7 hours/day, slightly
less than the 2.8 hours for 2013. Those 15–44 years of
age spent the fewest hours watching TV, or 2.0 hours;
those older than 65 the most, at 4.0 hours.
Who Spends the Most and Least
Time on Leisure?
The amount of time spent on leisure decreases with
higher levels of education. Those with less than a high
school diploma spent 5.85 hours; a high school
diploma, 5.72; some college/associate’s degree, 5.03;
bachelor’s degree, 4.61; and advanced degree, 4.54.
Married people had less leisure time, 4.90 hours on
average, compared to 5.36 hours for others. Those
aged 35–44 had the least leisure time at 3.97 hours,
followed by 25–34 at 4.13. Those 65–74 and 75+ had
the most, 6.92 hours and 7.60 hours, respectively.
Activities, such as running and exercise, typically have
a morning peak and an evening peak. Hiking, fishing
and boating have an even time distribution throughout
the day and bowling, martial arts, softball and dancing
are done primarily in the evening.
Every Day Has Time for Media
IAB’s Personal Prime Time 2018 report found
consumers regularly use media throughout the day. The
most common media activities are check weather, 80%;
check news, 76%; watch shows, 75%; listen to music,
74%; and check social media, 69%.
Those aged 18–34 are most likely to listen to music,
87%; check, 83%, and post, 55%, to social media; and
listen to podcasts, 28%. Those 55+ are most likely to
check weather, 85%, and news, 83%; and those 35–54
are most likely to watch shows, 79%.
Although mobile devices, desktop computers and
Internet TV are used for many media activities,
traditional TV is still dominant for watching shows
throughout all dayparts, most during the late morning,
76%, and least during late night, 59%.
What Millennials Do for Fun
Although according to Fung Global Retail
Technology’s 2016 Millennials and Leisure report
Millennials would like to spend money on leisure,
they spend less than other age groups because
they have less money.
Millennials spend less on travel because they
forego vacation time. Restaurant dining
accounted for 48% of their leisure budget; 53%
ate at a restaurant at least once a week. They
were active in fitness, 66.7%; yoga, 20%; and
outdoor sports, 57.
Millennials streamed more than half (54%) of their
television content compared to 29% for
Americans 18 and older. Only 25% of their
viewing was live TV.
Work Hard, Play Little
Contrary to expectations, men who earned the most
money dedicated the least amount of time to leisure
activities. Experts theorize it is because of social
pressure among peers or because they derive
enjoyment and fulfillment from work.
Those with less education participated more in leisure
activities because of unemployment or
underemployment. Those without a high school diploma
spent, on average, 2.72 hours/ day working compared to
4.50 hours for those with a Bachelor’s degree or higher.
Among all adults who work, the average hours worked
was 8.02, 8.52 for men and 7.41 for women.
Advertising Strategies
Suggest local retailers advertise specials and/or
bundles of merchandise at a discounted price that
would help customers/consumers enjoy their leisure
time more, especially merchandise that relates to
being healthier.
Although television is where more advertisers can
reach Baby Boomers to promote leisure activities
and/or related merchandise, local businesses should
also consider entering into strategic partnerships with
senior communities, exercise facilities, etc.
Leisure-activity facilities and/or retailers of related
merchandise may find it effective to run spots during
late-night TV and promote an “On-Your-Feet”
campaign to reach younger adults, advocating one
hour of physical activity for every hour of watching TV.
New Media Strategies
Hobby shops, toy stores and similar retailers can use
social media to reach parents to promote family-
activity time with hobbies, games, etc. instead of
everyone watching their favorite TV shows on
separate devices in separate rooms.
Consider using LinkedIn to reach professionals,
especially men, to advocate they dedicate a bit more
time for leisure activities. Promote your business’
specific activities and/or related merchandise with
mobile coupons.
Use social media to reach Millennials with short
videos featuring tips about how to find and save
money on low-cost leisure activities and include a
special offer at the end of the video for your facility or
business and/or related merchandise.
Americans spend varying amounts of time on leisure activities according to factors like age, education, and family status. Television remains a popular choice for leisure, with differences in usage among different age groups. Millennials show preferences for dining out, fitness activities, and streaming content. Higher earners surprisingly allocate less time to leisure. Media consumption is prevalent throughout the day, with traditional TV still holding a dominant position.

Download Presentation

Please find below an Image/Link to download the presentation.
The content on the website is provided AS IS for your information and personal use only. It may not be sold, licensed, or shared on other websites without obtaining consent from the author.If you encounter any issues during the download, it is possible that the publisher has removed the file from their server.
You are allowed to download the files provided on this website for personal or commercial use, subject to the condition that they are used lawfully. All files are the property of their respective owners.
The content on the website is provided AS IS for your information and personal use only. It may not be sold, licensed, or shared on other websites without obtaining consent from the author.
E N D
Presentation Transcript
How Americans Allocate Their Leisure Time According to the US Bureau of Labor Statistics American Time Use Survey for 2016, employed adults with no children younger than 18 in the household spent 4.5 hours/day on leisure activities; employed adults living with a child younger than 6 spent 3.3 hours. For all persons, 15 years of age and older, men s time for leisure activities decreased from 5.9 hours for 2013 to 5.5 hours for 2016. Women also had less time for leisure activities during 2016 (4.8 hours) compared to 2013 (5.2 hours). Television viewing continued to be the #1 leisure activities in terms of time spent, at 2.7 hours/day, slightly less than the 2.8 hours for 2013. Those 15 44 years of age spent the fewest hours watching TV, or 2.0 hours; those older than 65 the most, at 4.0 hours.
Who Spends the Most and Least Time on Leisure? The amount of time spent on leisure decreases with higher levels of education. Those with less than a high school diploma spent 5.85 hours; a high school diploma, 5.72; some college/associate s degree, 5.03; bachelor s degree, 4.61; and advanced degree, 4.54. Married people had less leisure time, 4.90 hours on average, compared to 5.36 hours for others. Those aged 35 44 had the least leisure time at 3.97 hours, followed by 25 34 at 4.13. Those 65 74 and 75+ had the most, 6.92 hours and 7.60 hours, respectively. Activities, such as running and exercise, typically have a morning peak and an evening peak. Hiking, fishing and boating have an even time distribution throughout the day and bowling, martial arts, softball and dancing are done primarily in the evening.
Every Day Has Time for Media IAB s Personal Prime Time 2018 report found consumers regularly use media throughout the day. The most common media activities are check weather, 80%; check news, 76%; watch shows, 75%; listen to music, 74%; and check social media, 69%. Those aged 18 34 are most likely to listen to music, 87%; check, 83%, and post, 55%, to social media; and listen to podcasts, 28%. Those 55+ are most likely to check weather, 85%, and news, 83%; and those 35 54 are most likely to watch shows, 79%. Although mobile devices, desktop computers and Internet TV are used for many media activities, traditional TV is still dominant for watching shows throughout all dayparts, most during the late morning, 76%, and least during late night, 59%.
What Millennials Do for Fun Although according to Fung Global Retail Technology s 2016 Millennials and Leisure report Millennials would like to spend money on leisure, they spend less than other age groups because they have less money. Millennials spend less on travel because they forego vacation time. Restaurant dining accounted for 48% of their leisure budget; 53% ate at a restaurant at least once a week. They were active in fitness, 66.7%; yoga, 20%; and outdoor sports, 57. Millennials streamed more than half (54%) of their television content compared to 29% for Americans 18 and older. Only 25% of their viewing was live TV.
Work Hard, Play Little Contrary to expectations, men who earned the most money dedicated the least amount of time to leisure activities. Experts theorize it is because of social pressure among peers or because they derive enjoyment and fulfillment from work. Those with less education participated more in leisure activities because of unemployment or underemployment. Those without a high school diploma spent, on average, 2.72 hours/ day working compared to 4.50 hours for those with a Bachelor s degree or higher. Among all adults who work, the average hours worked was 8.02, 8.52 for men and 7.41 for women.
Advertising Strategies Suggest local retailers advertise specials and/or bundles of merchandise at a discounted price that would help customers/consumers enjoy their leisure time more, especially merchandise that relates to being healthier. Although television is where more advertisers can reach Baby Boomers to promote leisure activities and/or related merchandise, local businesses should also consider entering into strategic partnerships with senior communities, exercise facilities, etc. Leisure-activity facilities and/or retailers of related merchandise may find it effective to run spots during late-night TV and promote an On-Your-Feet campaign to reach younger adults, advocating one hour of physical activity for every hour of watching TV.
New Media Strategies Hobby shops, toy stores and similar retailers can use social media to reach parents to promote family- activity time with hobbies, games, etc. instead of everyone watching their favorite TV shows on separate devices in separate rooms. Consider using LinkedIn to reach professionals, especially men, to advocate they dedicate a bit more time for leisure activities. Promote your business specific activities and/or related merchandise with mobile coupons. Use social media to reach Millennials with short videos featuring tips about how to find and save money on low-cost leisure activities and include a special offer at the end of the video for your facility or business and/or related merchandise.