Insights on First-Year Seminars: 2009 National Survey Findings
Delve into the world of First-Year Seminars with data from the 2009 National Survey, exploring the types of seminars, participants' institutions, seminar sizes, and trends across institutions. Gain valuable insights into the landscape of first-year academic experiences in higher education.
Download Presentation

Please find below an Image/Link to download the presentation.
The content on the website is provided AS IS for your information and personal use only. It may not be sold, licensed, or shared on other websites without obtaining consent from the author.If you encounter any issues during the download, it is possible that the publisher has removed the file from their server.
You are allowed to download the files provided on this website for personal or commercial use, subject to the condition that they are used lawfully. All files are the property of their respective owners.
The content on the website is provided AS IS for your information and personal use only. It may not be sold, licensed, or shared on other websites without obtaining consent from the author.
E N D
Presentation Transcript
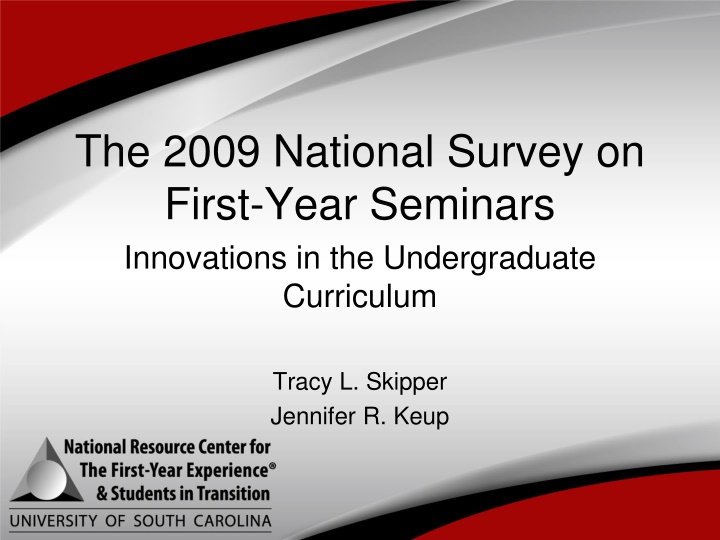
The 2009 National Survey on First-Year Seminars Innovations in the Undergraduate Curriculum Tracy L. Skipper Jennifer R. Keup
What Is a First-Year Seminar? A course designed to assist students in their academic and social development and in their transition to college. A seminar, by definition, is a small discussion-based course in which students and their instructors exchange ideas and information. In most cases, there is a strong emphasis on creating community in the classroom. (Hunter & Linder, 2005, pp. 275-276).
Types of First-Year Seminars Extended orientation seminars Academic seminars with generally uniform content Academic seminars on various topics Professional or discipline-based seminars Basic study skills seminars Hybrid seminars
National Survey of First-Year Seminars Overview of survey history Methodology for 2009 administration Administration: Oct. 30 Dec. 18, 2010 Invitation sent to 3,225 institutions in 3 waves: Chief Academic Officer Chief Executive Officer Chief Student Affairs Officer Incentive program 1,028 usable responses (32% response rate)
Participants Institution Type Two-year Four-year Public Private, not-for-profit Private, for-profit Number 293 725 528 422 68 Percentage 28.8 71.2 51.9 41.5 6.7
Participants Size of First-Year Class < 500 501 1,000 1,001 1500 1,501 2,000 2,001 2,500 2,501 3,000 3,001 3,500 3,500 4,000 4,001 5,000 > 5,000 Number 365 238 107 87 50 37 36 21 32 45 Percentage 35.9 23.4 10.5 8.5 4.9 3.6 3.5 2.1 3.1 4.4
Types of Seminars Across All Institutions 2009 Survey All Seminars (N = 890) (N = 890) 61.6% 41.4% 2006 Survey Primary Type All Seminars (N = 821) 57.9% Primary Type (N = 821) 40.9% EO 28.1% 17.4% ACC 25.9% 16.1% 25.7% 17.9% AVC 23.4% 15.4% 21.6% 5.8% Basic 22.4% 4.9% 14.9% 20.3% 4.4% 1.6% 16.2% 0.3% Prof. Hybrid Other 14.4% 22.5% 2.5% 3.7% 15.3% 3.5%
Administrative Home of First-Year Seminar Unit 2009 2006 Academic affairs Academic department Student affairs First-year program office College or school 51.0% 13.5% 13.0% 10.5% NA 37.0% 16.3% 13.8% 12.0% 7.9% 75.1% of courses have a seminar director 37.9% of course directors are full time
Administration of Seminars Average size of seminar program is around 30-32 sections A majority of seminars have classes enrolling 16 to 25 students 58.2% Over one-third (39.6%) of institutions require all first-year students to take the seminar
Grading and Credit Hours Most seminars (80.5%) are letter graded More than 43% of seminars are offered for one credit hour; about 32% of seminars are offered for three credit hours Seminar credit applies toward graduation in most cases General education 93.6% As an elective 88.2% To the major 60.2%
Who Teaches the Seminar? Instructors 2009 2006 Faculty members NA 90.0% Tenure track faculty NA 60.7% FT non-tenure track faculty NA 53.7% Adjunct faculty NA 45.4%
Who Teaches the Seminar? Instructors 2009 2006 Student affairs professionals 47.6% 45.2% Other campus professionals 29.7% 27.0% Graduate students 5.2% 5.6% Undergraduate students 7.7% 5.1%
Who Teaches the Seminar? 43.5% of institutions have some team taught sections of the seminar 8.6% team teach all sections 31.2% of institutions have some sections of the seminar taught by the students academic advisors
How Are Instructors Compensated? Compensation Adj Tenure-Trk Faculty 35.7% Stud Affrs Other Prof Grad Student 36.0% NA Faculty 13.7% None Grad Student Support Release Time Stipend Prof Dev Funds Other 34.6% 33.3% .5% 2.0% 52.5% 1.5% 35.3% .4% 5.1% 37.1% 2.4% 29.2% .5% 5.4% 46.7% 1.9% 22.2% .4% 4.1% 44.4% 1.5% 28.6% NA 54.0% NA 26.0%
How Are Instructors Compensated? 1: $500 or less 2: $501-$1000 3: $1001-$1500 4: $1501-$2000 7: $3001-$3500 10: $4501-$5000 5: $2001-$2500 8: $3501-$4000 11: >$5000 6: $2501-$3000 9: $4001-$4500 Mean Stipend 3.80 3.40 3.39 3.04 2.70 Adjunct faculty Other professional Tenure track faculty Student affairs professionals Graduate student
Top 5 Seminar Goals Most Important Course Goals Develop academic skills Develop a connection w/institution Orient to campus resources 2009 54.6% 64.2% 50.2% 47.8% 52.9% 2006 n/a Encouraged self-exploration/personal development Create common first-year experience 28.5% 36.9% 23.3% 35.9%
Top 5 Course Topics Most Important Course Topics 2009 2006 Campus resources 38.1% 42.4% Study skills 40.8% 39.8% Academic planning/advising 36.7% 35.8% Critical thinking 40.6% 34.9% Time management 28.6% 27.6%
Course Practices Practice Online component Service-learning Learning-community Common reading component 2009 52.9% 40.3% 35.7% 30.9% 2006 49.1% 40.2% 35.3% NA
Online Components Nearly half of the open-ended responses mention the use of a course or learning management system. Most common online components: Repository for course documents (e.g., syllabi, readings, resources, assignments, podcasts, lecture notes) Discussion boards Assignment submission Introduction to online research/information literacy Quizzes/tests Assessments
Service-Learning Service experience varies widely by section and is often tied to specific course theme. Service is of short duration, usually less than 10 hours, and is on many campuses a one- shot experience or service plunge. Hunger/homelessness and at-risk youth most common focal points for service. Reflection includes written papers, class discussions, and presentations.
Learning Community Structures LCs designed to serve a variety of student populations, but most commonly mentioned as either major-specific interventions or interventions for at-risk students. Seminars frequently linked to developmental course work in English, reading, and math. Seminars linked to a variety of gen ed courses, but most commonly linked to first- year composition.
Learning Community Structures LC structures range from block scheduling with little to no course integration to highly integrated thematic course links. LCs frequently incorporate a residential component.
Quantitative Assessment Strategies Assessment Student course evaluation Survey instrument Locally developed National survey NSSE CCSSE YFCY FYI Institutional data 2009 94.9% 75.3% 84.0% 52.4% 73.6% 12.9% 12.3% 9.1% 75.3% 2006 97.2% 82.4% 88.7% 57.7% 72.2% n/a 10.6% 12.2% 79.2%
Qualitative Assessment Strategies Assessment Focus Groups Instructors Students Interviews Instructors Students 2009 2006 63.5% 51.2% 51.3% 51.9% 53.5% 36.8% 45.6% 30.4%
Outcomes Measured Outcome Persistence to sophomore year Satisfaction with faculty Satisfaction with institution Grade-point average Use of campus services Connections with peers Participation in campus activities Out-of-class student/faculty interactions Academic abilities Persistence to graduation Other Number 263 253 233 207 182 176 175 168 149 137 65 Percentage 55.4 53.3 50.0 43.6 38.3 37.1 36.8 35.4 31.4 28.8 13.7
For More Information Dr. Jennifer R. Keup, Director E-mail: keupj@mailbox.sc.edu Phone: (803) 777-2570 Dr. Tracy L. Skipper Assistant Director for Publications E-mail: tlskippe@mailbox.sc.edu Phone: (803) 777-6226
