Insights on Fire and Soil Moisture Relationships from Max-Planck-Institute Research
Explore the fascinating research findings on the interaction between fire dynamics and soil moisture content, as studied by scientists from the Max-Planck-Institute for Meteorology in Hamburg. Discover details on burned areas, carbon emissions, biomass consumption, fire impacts on vegetation, and more, shedding light on environmental processes and ecosystem health.

Download Presentation

Please find below an Image/Link to download the presentation.
The content on the website is provided AS IS for your information and personal use only. It may not be sold, licensed, or shared on other websites without obtaining consent from the author.If you encounter any issues during the download, it is possible that the publisher has removed the file from their server.
You are allowed to download the files provided on this website for personal or commercial use, subject to the condition that they are used lawfully. All files are the property of their respective owners.
The content on the website is provided AS IS for your information and personal use only. It may not be sold, licensed, or shared on other websites without obtaining consent from the author.
E N D
Presentation Transcript
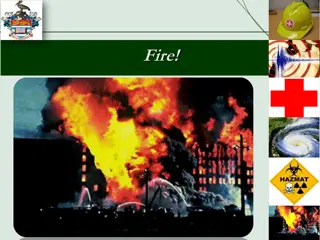
Fire / Soil Moisture Stiig Wilkenskjeld, Gitta Lasslop Silvia Kloster Max-Planck-Institute for Meteorology Hamburg
Fire Soil Moisture CCI SM ESA CCI & GFEDv3 GFEDv4
Fire Soil Moisture relative burned area [] Relative soil moisture [%]
Fire Soil Moisture Relative width deviation [] Relative peak deviation []
Fire Soil Moisture Relative width deviation [] Relative peak deviation [] MPI-ESM / CMIP6 simulations
Fire Burned area Carbon Emissions Biomass consumed Fire Emissions Burned Area
Fire Burned area Carbon Emissions Biomass consumed Fire Emissions Burned Area Fire CCI v 4.1 2005 2011 0.25 x 0.25 Bi-weekly
Fire Burned area Carbon Emissions Biomass consumed Fire Emissions Burned Area Fire CCI v 4.1 Vegetation Model 2005 2011 JSBACH (MPI-ESM) - - - - what is burning (tree/grass)? how much is burning ? did the fire kill the tree? what happened before 2005? 0.25 x 0.25 Bi-weekly
Fire Burned area Carbon Emissions Biomass consumed Fire Emissions Burned Area Fire CCI v 4.1 Vegetation Model 2005 2011 JSBACH (MPI-ESM) - - - - what is burning (tree/grass)? how much is burning ? did the fire kill the tree? what happened before 2005? 0.25 x 0.25 Bi-weekly
Fire Burned area Carbon Emissions C emissions 2.19 PgC/year burned area 346 Mha
Fire Burned area Carbon Emissions C emissions 2.19 PgC/year burned area 346 Mha GFED4s: 402 Mha 2.18 PgC/year (van der Werf in prep.)
Fire Burned area Carbon Emissions C emissions 2005 - 2011 burned area 2005 - 2011 2005. 2006. 2007 2008 2009. 2010 2011 2005. 2006. 2007 2008 2009. 2010 2011
Fire Burned area Carbon Emissions Simulation Burned Land Cover Combustio n completen ess Fire Carbon Emission [PgC/year] Area JSBACH FIRE CCI JSBACH f(soil moisture), max=0.3 2.19 CCI FIRE CCI LC CCI f(soil moisture), max=0.3 1.86 JSBACH_B oreal FIRE CCI JSBACH f(soil moisture), boreal = 0.6 2.21
Fire Burned area Carbon Emissions Simulation Burned Area Land Cover Combustion completenes s Fire Carbon Emission [PgC/year] JSBACH FIRE CCI JSBACH f(soil moisture), max=0.3 2.19 JSBACH + FIRE CCI + uncertainty JSBACH f(soil moisture), max=0.3 2.52 (+15 %) JSBACH - FIRE CCI - uncertainty JSBACH f(soil moisture), max=0.3 1.78 (-19%) Burned area Min= 248 Mha / Max = 444 Mha +/- 28%
Summary / Outlook ESA CCI burned area as boundary condition in JSBACH fire emissions Consistency between FIRE CCI and LC CCI assures that models burn the correct trees use new release of FIRE CCI (2000 2016) ESA CCI burned area as boundary conditions in Vegetation Models Model intercomparison Protocol development Transport fire emissions compare to ESA CCI GHG