Soil Chemistry and Mineralogy Analysis at CSU Summer Soil Institute
Explore the comprehensive analysis of soil chemistry, texture, and mineralogy conducted at the CSU Summer Soil Institute in July 2010. The study delves into pedology, elemental composition, particle size distribution, X-ray diffractometry, and mineralogical composition of various soil samples. Detailed methodologies, including chemical dispersions, hydrometer readings, and total elemental analysis, provide valuable insights into the soil's properties and composition.
Uploaded on Sep 18, 2024 | 2 Views
Download Presentation

Please find below an Image/Link to download the presentation.
The content on the website is provided AS IS for your information and personal use only. It may not be sold, licensed, or shared on other websites without obtaining consent from the author.If you encounter any issues during the download, it is possible that the publisher has removed the file from their server.
You are allowed to download the files provided on this website for personal or commercial use, subject to the condition that they are used lawfully. All files are the property of their respective owners.
The content on the website is provided AS IS for your information and personal use only. It may not be sold, licensed, or shared on other websites without obtaining consent from the author.
E N D
Presentation Transcript
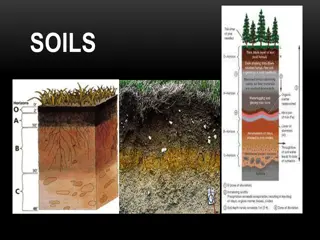
Pedology and Soil Chemistry CSU Summer Soil Institute 23 July 2010 Claudia, Erin, Nam Jin and Dylan
pedology % N %OC 0.86 0.02 0.02 C:N 55.8 39.5 22.5 8.5 10.7 9.9 FEF - O FEF 2-1 FEF 2-2 FEF 2-3 0.013 0.11 FEF 2-4 0.015 0.16 FEF 2-5 0.01 0.099 48 0.79 0.45
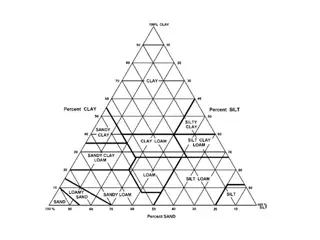
soil texture Sand: 2 mm .050 mm Silt: .050 mm .002 mm Clay < .002 mm http://school.discovery.com/schooladventures/soil/teacher_tips.html
texture Particle size distribution analysis (PDSA) > 2mm Chemical dispersion w sodium hexaphosphate Shake/stir Hydrometer reading w/ time May need to remove Organic C (H2O2) Fe (Na dithoinate) Carbonate (NaOAc) SGS 51% sand, 16% clay, 33% silt
X-ray diffractometry (XRD) Diffraction pattern based on crystal structure of minerals Use samples from texture analysis Bulk soil Quartz Feldspar Clay fraction 2:1 clays (2 tetrahedral sheets (Si)/octahedral (Al)) semectite vermiculite mica
mineralogy-XRD FEF-E FEF-Bt1 FEF-Bt1 Bulk soil: high quartz and feldspar w/ mica present
mineralogy-XRD FEF-A FEF-Bt1 FEF-BtK1 Clay fraction: mixed mineralogical composition dominated by the 2:1 clays but the presence of some poorly crystalline material as well.
total elemental analysis sample prep soil solution free of particulates extraction dissolution acidification (HCl, HNO3) analyses ICP (inductively coupled plasma optical emission spectrometer) hot, hot, hot 10000 K and gassy energy absorbed=emission spectra
ANALYT E METHOD DETECTI ON UNITS Al2O3 CaOCr2O3 Fe2O3 K2O MgO MnO Na2O P2O5 SiO2 TiO2 Ba Nb Sr Y Zn Zr LOI Sum 0.01 0.01 0.01 % % 0.01 % 0.01 % 0.01 % 0.01 % 0.01 % 0.01 % 0.01 % 0.01 % 10 PPM 10 PPM 10 PPM 10 PPM 5 10 PPM 0.01 % 0.01 % % PPM FEF 2-1 12.8 0.78 0.04 4.67 2.65 1.37 0.04 1.34 0.09 67.9 0.6 560 30 130 60 85 250 5.6 98 FEF 2-2 13.6 0.75 0.03 5.6 2.75 1.72 0.05 1.21 0.1 66.4 0.6 540 40 120 50 95 240 5.2 98.1 FEF 2-3 13.6 0.75 0.02 5.57 2.71 1.71 0.05 1.27 0.1 66.1 0.6 540 40 120 60 98 250 6.5 99 FEF 2-4 15.3 0.79 0.02 6.81 2.9 2.09 0.06 1.27 0.12 60.7 0.68 560 40 130 60 110 270 4.6 95.5 FEF 2-5 15.3 0.84 0.02 6.57 2.9 2.07 0.06 1.33 0.12 64.3 0.64 570 40 130 50 107 280 3.7 97.9 ANALYT E Al Ca Cr Fe K Mg Mn Na P Si Ti Ba Nb Sr Y Zn Zr LOI Sum METHOD ICP-95 DETECTI ON UNITS 0.01 0.01 0.01 % % 0.01 % 0.01 % 0.01 % 0.01 % 0.01 % 0.01 % 0.01 % 0.01 % 10 % 10 % 10 % 10 % 5 % 10 % 0.01 % 0.01 % % FEF 2-1 6.77 0.56 0.03 2.06 2.20 0.83 0.03 0.99 0.04 33.97 0.36 0.06 0.00 0.01 0.01 0.01 0.03 5.6 98 FEF 2-2 7.20 0.54 0.02 2.47 2.28 1.04 0.04 0.90 0.04 33.22 0.36 0.05 0.00 0.01 0.01 0.01 0.02 5.2 98.1 FEF 2-3 7.20 0.54 0.01 2.46 2.25 1.03 0.04 0.94 0.04 33.07 0.36 0.05 0.00 0.01 0.01 0.01 0.03 6.5 99 FEF 2-4 8.10 0.56 0.01 3.01 2.41 1.26 0.05 0.94 0.05 30.37 0.41 0.06 0.00 0.01 0.01 0.01 0.03 4.6 95.5 FEF 2-5 8.10 0.60 0.01 2.90 2.41 1.25 0.05 0.99 0.05 32.17 0.38 0.06 0.00 0.01 0.01 0.01 0.03 3.7 97.9
mass balance weathering + pedogenesis net gains and losses collapse mineral dissolution dilation elemental additions uses elemental analyses relative to immobile element e.g. nomibium, zirconium
total elemental analysis P K Ca Na Mg Al Fe Mn Si FEF-?? 1.00 Dilation & Addition Collapse & Addition soil is dilating while losing elements 0.50 j,w 0.00 Collapse & Loss -0.50 gaining Ca+ dust? Dilation & Loss -1.00 -1.00 -0.50 0.00 Zr,w 0.50 1.00
elemental mass transfer: -1.0 total loss, 0.0 no loss Si,w K,w Fe,w -1.00 0.00 1.00 -1.00 0.00 1.00 -1.00 0.00 1.00 0 0 0 20 20 20 40 40 40 Depth (cm) Depth (cm) Depth (cm) 60 60 60 80 80 80 100 100 100 120 120 120 Flux: -6.8 140 140 140 80% Si retained 1o min biotite kaolinite 50% Fe 40% K retained biotite kaolinite & geothite
soil chemistry NMR intro humic and fulvic acids SEM minerals soils surprises
How NMR Works spin number (I) when I = NMR spectra can be measured place nuclei in magnetic field = B0 nuclei will align with and against B0 add energy and nuclei will spin flip 1H, 13C, 15N
scanning electron microscopy (SEM) schwertmannite e- beam to visualize samples large depth of field electron column e- source magnetic lenses to de-magnify magnetic coils to control beam apertures to define beam vacuum system pumps valves detection and display detectors electronics gold coat (sputter) samples microgoethite
humic acid fulvic acid
SGS soil Fraser soil
? EDS: electron dispersive spectroscopy gives elemental composition of SEM image iron sulfide!
conclusions pedology is the foundation of soil science texture mineralogy mass balance soil chemistry is more than just acronyms composition drives decomposition lots o tools to describe
