Insights into Older Adult Population in Alameda County
Explore demographic trends and social determinants of health for older adults in Alameda County from 1970 to 2060. Learn about the age distribution, population projections, and demographics by gender and race/ethnicity. Gain valuable insights into the growing older adult population in the region.
Download Presentation

Please find below an Image/Link to download the presentation.
The content on the website is provided AS IS for your information and personal use only. It may not be sold, licensed, or shared on other websites without obtaining consent from the author. If you encounter any issues during the download, it is possible that the publisher has removed the file from their server.
You are allowed to download the files provided on this website for personal or commercial use, subject to the condition that they are used lawfully. All files are the property of their respective owners.
The content on the website is provided AS IS for your information and personal use only. It may not be sold, licensed, or shared on other websites without obtaining consent from the author.
E N D
Presentation Transcript
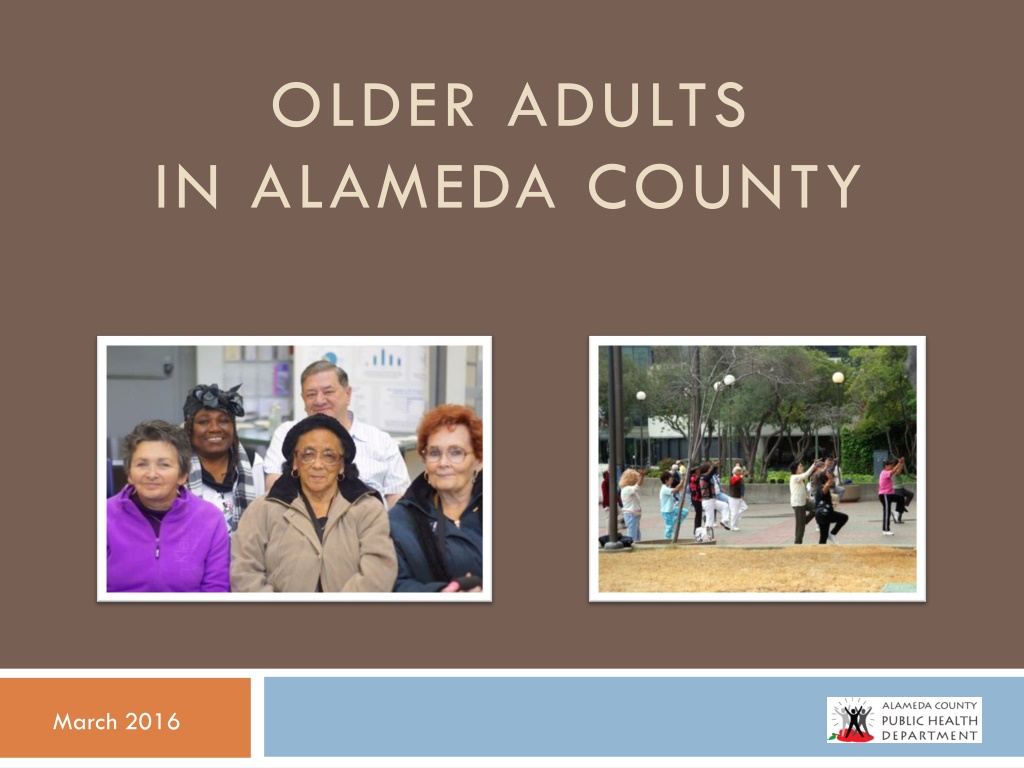
OLDER ADULTS IN ALAMEDA COUNTY March 2016
DEMOGRAPHICS & SOCIAL DETERMINANTS OF HEALTH
Age Distribution of Population in Alameda County Age Pyramid, 1980 Age Pyramid, 2015 1980 2015 48% growth in 65+ population 87% growth in 45-64 Baby Boomers Source: US Census Bureau, 1980 and 2010
Older Adult Population: 1970-2010 200,000 55-64 years 65+ years 150,000 Population 100,000 50,000 0 1970 1980 1990 2000 2010 Census Year 1970-2010 70% growth in 65+ population 89% growth in 55-64 Baby Boomers Source: US Census Bureau, 1970-2010
Older Adults as Share of Total Population: 1970-2010 14% 55-64 years 65+ years 12% 11.5% 11.2% 10.6% 10.3% 10.2% 10% 9.4% 9.3% Percentage of Population 8.6% 7.8% 8% 7.4% 6% 4% 2% 0% 1970 1980 1990 2000 2010 Census Year Source: US Census Bureau, 1970-2010
Population Projections Ages 65+: 2020-2060 600,000 519,942 480,628 500,000 435,747 400,000 368,005 Population 300,000 263,920 200,000 99,687114,206135,780147,591169,143 100,000 0 1970 1980 1990 2000 2010 2020 2030 2040 2050 2060 Census Year Source: California Department of Finance, Report P-1 (Age), State and County Population Projections by Major Age Groups, 2020-2060; US Census Bureau Data 1970-2010
Older Adult (65+) Population in Alameda County 65+ 201,297 13% <12 235,708 15% 12-24 272,616 17% 45-64 415,116 26% 25-44 455,346 29% Source: CAPE, with data from ESRI, 2015
Older Adult Demographics Older Adults by Gender Older Adults by Race/Ethnicity American Indian 0.2% Pacific Islander 0.4% Other 0.2% Multi-Race 2% White 48% Hispanic/ Latino 11% Male 44% African American/ Black 12% Female 56% Asian 27% Source: CAPE, with data from ESRI, 2015
Older Adult Demographics (continued) Older Adults by Older Adults by Language Spoken at Home Place of Birth & Citizenship Status Language other than English 40% Naturalized US citizen 28% Foreign- born 38% US-born 62% Not a US citizen 10% English only 60% Over 1 in 3 older adults are foreign-born 1 in 10 older adults are not US citizens Many older adults (40%) speak a language other than English at home Source: American Community Survey, 2014
Older Adult Socioeconomic Status Poverty Levels among Older Adults <100% of FPL 11% 100%-199% of FPL 16% 300%+ of FPL 58% 200%-299% of FPL 15% Just over 1 in 10 older adults live under the federal poverty line Over 1 in 4 older adults earn <200% of FPL Source: American Community Survey, 2014
Older Adult Socioeconomic Status (continued) Annual Cost of Living for Single Older Adults $45,000 $38,390 $40,000 $35,000 $27,500 $30,000 Other Transportation Food Health Care Housing $25,000 $18,486 $20,000 $15,000 $10,000 $5,000 $0 Older adult, homeowner, without mortage Older adult, renter Older adult, homeowner, with mortage Source: CAPE, with 2011 data from UCLA Center for Health Policy Research adjusted to 2014
Older Adult Socioeconomic Status (continued) Percentage of Older Adults Living Under 200% of FPL by City/Place Cherryland Ashland Oakland San Lorenzo San Leandro Alameda County Union City Hayward Newark Berkeley Fremont Remainder of County Alameda Castro Valley Emeryville Livermore Pleasanton Fairview Sunol Dublin Albany Piedmont 0% 10% 20% 30% 40% 50% Source: American Community Survey, 2010-2014
Older Adult Socioeconomic Status (continued) Older Adults by Education Level Older Adults by Employment Status In labor force, Employed 18% <HS Degree 19% Bachelor's Degree+ 33% In labor force, Unemployed 1% HS Degree/GED 23% Not in labor force 81% Some College 25% 1 in 3 older adults have college degree+ Almost 1 in 5 older adults have <HS degree Almost 1 in 5 older adults have a job or are looking for a job 1% are unemployed Source: American Community Survey, 2014
Older Adult Household and Living Circumstances Older Adults by Marital Status Older Adults by Household Type Live with others who are not family 5% Live in group quarters 3% Never Married 6% Separated 2% Divorced 14% Live alone 24% Married 52% Widowed 26% Live with family 68% Over half of older adults are married Over one-fourth are widowed About two-thirds of older adults live with family About one-fourth live alone Source: American Community Survey, 2014
Older Adult Household and Living Circumstances (continued) Older Adults by Housing Tenure Housing Cost Burden among Older Adults (60+) Owner-occupied housing units* Renter-occupied housing units** Renter- occupied housing unit 30% Owner- Occupied housing unit 70% Percentage spending 30% of household income on housing 30% 62% The majority of older adults are home owners or live with home owners. Just under one-third are renters. Housing cost burden affects: Over 60% of older adults in rental housing. 30% of older adults in owner-occupied housing. *Select monthly owner costs as a percentage of household income in past 12 months **Gross rent as a percentage of household income in the past 12 months Source: American Community Survey, 2014
Leading Causes of Death among Older Adults (65+) 1. Cancer 2. Heart Disease 3. Stroke 4. Alzheimer s Disease 5. Chronic Lower Respiratory Disease 23% 23% 7% 6% 5% Top 5 conditions account for 64% of deaths among older adults Source: Alameda County Vital Statistics, 2012-2014
Heavy Health Toll and Cost of Chronic Disease Chronic diseases are among the most common, costly, and preventable of all health problems. Nationwide, about 80%-90% of older adults have a chronic disease. Over 50%-75% have more than 1 chronic disease. Chronic diseases are the leading cause of death and disability county-wide and nation-wide. Chronic diseases account for $3 of every $4 spent on healthcare. Beneficiaries with 2+ chronic conditions account for 93% of Medicare spending. Source: Centers for Disease Control and Prevention, Chronic Disease Overview , 2016; National Council on Aging, Healthy Aging Facts and Chronic Disease Self-Management Facts , 2014 and 2015; Centers for Medicare & Medicaid Services, Chronic Conditions Among Medicare Beneficiaries: Chartbook , 2012.
Leading Causes of Hospitalization among Older Adults (65+) Heart Disease 19,604 Infectious/Parasitic Diseases 15,157 Respiratory Disorders 13,623 Digestive System Disorders 12,516 Injuries 11,994 0 5,000 10,000 15,000 20,000 25,000 Number of Hospitalizations Source: Alameda County OSHPD Patient Discharge Data, 2012-2014
Disproportionate Share of Hospitalizations among Older Adults While older adults comprise 13% of the population in Alameda County, they account for: 30%of all hospitalizations in Alameda County 63% of hospitalizations due to stroke 61% of hospitalizations due to heart disease 58% of hospitalizations due to infectious/parasitic disease 51% of hospitalizations due to diabetes 47% of hospitalizations due to respiratory disorders Source: Alameda County OSHPD Patient Discharge Data, 2012-2014
Heart Disease Hospitalization Rate by Age Group 8000 7,202 7000 Age-Specific Rate per 100,000 6000 5000 4,161 4000 3000 2,211 2000 1,173 1000 548 195 75 27 15 9 0 <5 5-14 15-24 25-34 35-44 45-54 55-64 65-74 75-84 85+ Source: Alameda County OSHPD Patient Discharge Data, 2012-2014
Respiratory Disorders Hospitalization Rate by Age Group 6000 5,518 5000 Age-Specific Rate per 100,000 4000 2,815 3000 2000 1,449 1,395 798 1000 388 252 166 118 99 0 <5 5-14 15-24 25-34 35-44 45-54 55-64 65-74 75-84 85+ Source: Alameda County OSHPD Patient Discharge Data, 2012-2014
Stroke Hospitalization Rate by Age Group 3000 2,386 2500 Age-Specific Rate per 100,000 2000 1,372 1500 1000 686 500 344 164 58 16 9 5 3 0 <5 5-14 15-24 25-34 35-44 45-54 55-64 65-74 75-84 85+ Source: Alameda County OSHPD Patient Discharge Data, 2010-2012
Unintentional Injury ED Visit Rate* by Age Group and Gender Male Female 25,000 Age-Specific Rate per 100,000 20,000 15,000 10,000 5,000 0 <5 5-14 15-24 25-34 35-44 45-54 55-64 65-74 75-84 85+ Source: Alameda County OSHPD Emergency Department Data, 2011-2013 *Includes patients admitted through the facilities ED
Older Adult Unintentional Injury ED Visits* by Mechanism of Injury Other 22% Bites/Stings 3% Falls 50% Poisonings 3% Overexertion 3% Cutting/piercing 6% Struck by/against object 6% Motor vehicle 7% Source: Alameda County OSHPD Emergency Department Data, 2011-2013 *Includes patients admitted through the facilities ED
Mental Health Related Hospitalization Rate by Age Group 8,000 7,408 7,000 Age-Specific Rate per 100,000 6,000 5,000 4,000 3,104 3,000 1,6961,934 1,976 2,000 1,318 1,276 1,249 1,000 393 104 0 <5 5-14 15-24 25-34 35-44 45-54 55-64 65-74 75-84 85+ Source: Alameda County OSHPD Patient Discharge Data, 2012-2014
Depression Hospitalization Rate among Older Adults (65+) by Race 1,000 Associated Dx Primary Dx 900 800 700 Rate per 100,000 600 500 400 300 200 100 0 White Afr Am Latino API All Races Source: Alameda County OSHPD Patient Discharge Data, 2012-2014
Disability Status Age Distribution of People with Disabilities Disability Status by Age Group With a disability No disability 100% 65+ 65,128 42% 80% 49% 79% 60% 91% 96% 40% 51% 20% 21% 9% 4% 18-34 0% 35-64 65-74 75+ Age Group Source: American Community Survey, 2014
Disability Status (continued) Type of Disabilities among Older Adults (65+) 35% 33% 30% 25% 22% 20% 17% 15% 13% 10% 9% 10% 6% 5% 0% Any Disability Ambulatory Difficulty Independent Living Difficulty Hearing Difficulty Self-care Difficulty Cognitive Difficulty Vision Difficulty Source: American Community Survey, 2014
Disability Status (continued) Percentage of Older Adults with a Disability by City/Place Emeryville Hayward Cherryland San Lorenzo Ashland Oakland Fairview San Leandro Fremont Alameda County Castro Valley Livermore Union City Alameda Albany Pleasanton Newark Berkeley Dublin Piedmont Sunol 0% 10% 20% 30% 40% 50% Source: American Community Survey, 2010-2014
Health Insurance Status In Alameda County, 98% of older adults (65+) have health insurance coverage. While Medicare pays most medical expenses for older adults, it does not cover all expenses. Example services Medicare doesn t cover: long-term care, most dental care and dentures, eye exams for glasses/contacts, hearing aids and exams, routine foot care Medicare also has cost-sharing requirements that present barriers to care. Example costs include: Premiums for Medicare (Part B for physician services and Part D for prescription drugs) and supplemental insurance, deductibles, and co-payments Source: American Community Survey, 2010-2014; Centers for Medicare & Medicaid Services, Medicare.gov, 2016
Preventable Hospitalizations Rate of Preventable Hospitalizations Chronic Disease Composite 6,000 Age-Specific Rate per 100,000 4,777 5,000 4,000 3,324 3,000 2,520 1,807 2,000 6347641,0001,274 1,000 118 124 149 208 284413 0 Age Group Source: Alameda County OSHPD Patient Discharge Data, 2010-2012
Preventable Hospitalizations (continued) Rate of Preventable Hospitalizations Acute Illnesses Composite 5,000 4,492 Age-Specific Rate per 100,000 4,000 3,000 2,269 2,000 1,434 885 1,000 555 108 137 195 265368 80 72 68 58 0 Age Group Source: Alameda County OSHPD Patient Discharge Data, 2010-2012

