Insights into Homelessness in Springfield-Hampden County 2024
Discover key findings from the 2024 Homeless Point-in-Time Count in Springfield-Hampden County Continuum of Care. Explore data on homeless individuals, families, shelter beds, unsheltered populations, race disparities, subpopulations, and more.
Download Presentation

Please find below an Image/Link to download the presentation.
The content on the website is provided AS IS for your information and personal use only. It may not be sold, licensed, or shared on other websites without obtaining consent from the author. Download presentation by click this link. If you encounter any issues during the download, it is possible that the publisher has removed the file from their server.
E N D
Presentation Transcript
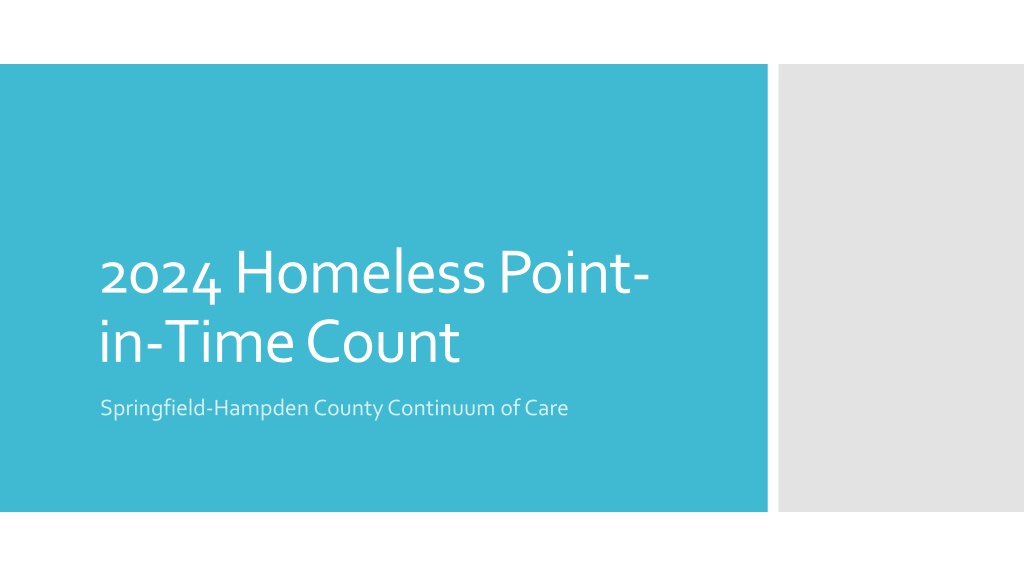
2024 Homeless Point- in-Time Count Springfield-Hampden County Continuum of Care
3,018 3,018 homeless people Under 18, 1, 0% Jan. 31, 2024 point-in-time count Individuals , 548, 18% Families, 2469, 82%
People in Families Individuals 2369 590 2093 560 549 Comparing the Counts 2020- 2024 1810 1793 1734 455 447 2020 2021 2022 2023 2024 2020 2021 2022 2023 2024
Homelessness disproportionately impacts people of color 60% 51% Race and Ethnicity Totals 41% 36% 26% 24% 23% 17% 9% Black/ African American Hispanic/ Latina Non-Hispanic White Hampden County General Population 2022 Point-in Time Homeless Population 2024 Point-in-Time Homeless Population
The number of shelter beds for individuals decreased from 2023 to 2024. The number of unsheltered homeless people increased. Individuals: Sheltered and Unsheltered 372 475 449 343 425 329 177 115 111 104 42 30 2021 2019 2020 2022 2023 2024 Unsheltered Sheltered
17 Chicopee 8 70 Holyoke 26 Location of Unsheltered Homelessness Palmer 1 74 Springfield 74 West 9 2 Springfield 4 Westfield 4 2024 2023
211 201 175 Chronically Homeless Individuals 115 90 69 59 2018 2019 2020 2021 2022 2023 2024
408 361 Homeless Sub Populations 214 192 178 177 172 146 98 96 89 71 2019 2020 2021 2022 2023 2024 Adults with a Serious Mental Illness Adults with Substance Use Disorder
This measure only counts the adults who report that they are fleeing DV. Where the fleeing household includes children, the children are not reflected in this count. 259 217 Fleeing Domestic Violence 143 132 100 2020 2021 2022 2023 2024
149 133 129 124 103 99 99 Individuals (without children) by Age Range 90 52 44 40 18 18-24 25-34 35-44 45-54 55-64 65 and older 2023 2024
42 62 54 33 37 Subpopulation Youth 18-24 63 61 57 52 50 Youth Populations data is a subset of the All Homeless Populations data. 2020 2021 2022 2023 2024 Parenting Youth Unaccompanied Youth
22 Subpopulation Veterans 26 18 18 Veteran Populations data is a subset of the All Homeless Populations data. 13 7 5 4 1 0 2020 2021 2022 2023 2024 Unsheltered Sheltered

