Insights into Fertilizer Cost Build-Up and Optimization Strategies
Explore the detailed cost breakdown of fertilizer pricing from import to retail in West Africa, uncovering the challenges and strategies to reduce costs. Discover the key factors influencing fertilizer prices, such as transportation, insurance, port charges, and more. Learn about optimizing costs through supply chain efficiencies and bargaining with suppliers. Gain valuable insights into reducing fertilizer prices at the farm gate and the journey of fertilizer distribution in the region.
Download Presentation

Please find below an Image/Link to download the presentation.
The content on the website is provided AS IS for your information and personal use only. It may not be sold, licensed, or shared on other websites without obtaining consent from the author.If you encounter any issues during the download, it is possible that the publisher has removed the file from their server.
You are allowed to download the files provided on this website for personal or commercial use, subject to the condition that they are used lawfully. All files are the property of their respective owners.
The content on the website is provided AS IS for your information and personal use only. It may not be sold, licensed, or shared on other websites without obtaining consent from the author.
E N D
Presentation Transcript
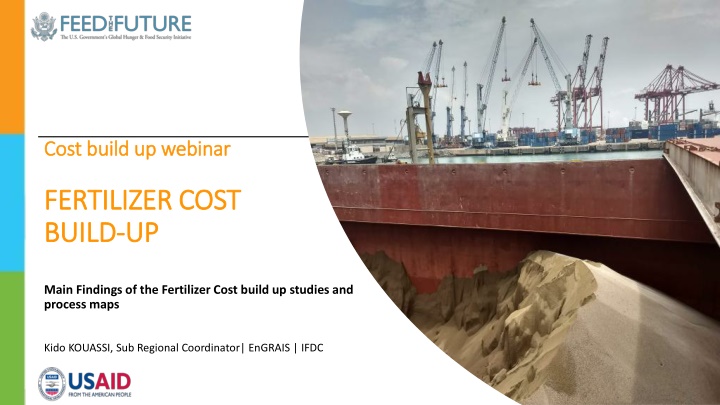
Cost build up webinar Cost build up webinar FERTILIZER COST FERTILIZER COST BUILD BUILD- -UP UP Main Findings of the Fertilizer Cost build up studies and process maps Kido KOUASSI, Sub Regional Coordinator| EnGRAIS | IFDC
Reducing Fertilizer Price At Farm Gate What Does It Take?
The Fertilizer Journey 280 $/MT 500 $/MT 550 $/MT 600 $/MT 640 $/MT Or 16 000 CFA/50Kg Bag Importer/Blender Insurance: Port Charges: Demurrage: Bagging: Transit: Custom Clearance: 6 Unbagging: Blending/Bagging: 25 Margin: Farmer Transport Distributor Transport: 20 Margin: Manufacturer/Trader FOB(Cost + Margin): 250 Freight: Wholesaler Transport: 10 Margin: Retailer Margin: 40 4 20 30 30 40 16 61 3 65
Detailed of costs build up At retail in Burkina Faso through port of Abidjan
Summarized Cost build up Simple Fertilizer Vs NPK Abidjan, Burkina Faso, and Mali through port of Abidjan
Optimizing the Cost : CFR Influence On CFR International Markets Oil, Fertilizer Commodity Seasonality Supply and Demand Larger Volumes Lower Shipping Cost Bargaining with Supplier Freight per Carrier Size Bulk carrier Handymax (30,000 to 60,000 tons/vessel) Min 20 22 23 23 Bulk carrier Handysize (15,000 to 30,000 tons/vessel) Min 26 28 29 29 Mini bulk carrier (1,000 to 10,000 tons/vessel) Container (24 to 25 tons/20 contain er ) These are values from Baltic Sea (Russia, Norway) in USD/ton Max 24 26 27 27 Max 30 32 33 33 Min 37 39 40 40 Max 41 43 44 44 Min 49 51 52 52 Max 54 56 57 57 Dakar Abidjan Tema Lom
Optimizing the Cost : Importing Charges Influenced by Stevedoring Port Charges custom clearance: Already Low Handling Fees Based on Location (in USD/ton) Bagging twice: Not Optimal 3.5 4.0 2.6 3.0 1.7 1.7 Minimum 2.0 1.3 0.9 0.9 0.8 0.7 Average 1.0 Maximum 0.0 Harbor City Major Hinterland City Average Hinterland City
Optimizing the Cost : Demurrage Daily Fee paid after Free Time Terminal Authorities Shipping company Average 1USD per Ton per Day Causes Weather Congestion Administrative delay Slow Handling
Optimizing the Cost : Avoiding Demurrage Importer Level Occurrence of wait times more than 5 days and more than 10 days before unloading in weeks in a year 60 Proactivity 50 Simplify Logistic 40 Negotiation Number of weeks/52 weeks with waiting time > 5 days Axis Title 30 Policy 20 Wavers for Fertilizers Number of weeks/52 weeks with waiting time > 10 days 10 Priority Berthing 0 Dakar Abidjan Tema Lome
Optimizing the Cost : Margin Bank interest in ECOWAS Margin Coverage Financial Cost Human Resources Rents/Storage Overheads Profit 55 50 Multinational Company 5% 45 40 35 30 National Company (UEMOA) 12% 25 20 15 10 National Company (Ghana) 20% 5 0 2 months 6 months 10 months (tendering) Warehouse Rental Cost (USD/ton/month) Optimizing Competion Market Growth Enabling Environment 15.0 Minimum 10.0 Average 5.0 Maximum 0.0
Taking The Knowledge from Port to Farms: The Fertilizer Cost Simulator Target: Private Sector Governments Fertilizer Acquisition Programs Objective: Easy to use Tool to Evaluate Cost Compare Logistic Options
