Inside Washington Policy Perspectives
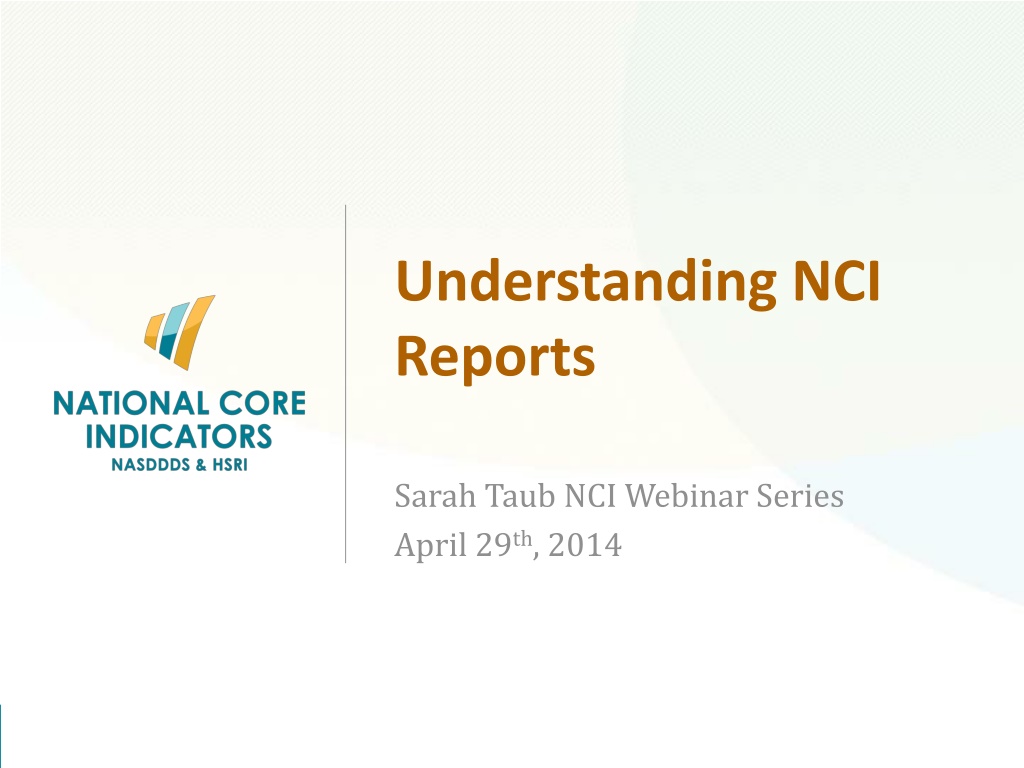


Understanding NCI
Reports
Sarah Taub NCI Webinar Series
April 29
th
, 2014
National Core Indicators (NCI)

Agenda
•
NCI Overview
•
Review of yearly reports
•
Review of data briefs
•
Review of Website tutorials
National Core Indicators (NCI)
WHAT IS
NATIONAL CORE INDICATORS (NCI)?
•
Multi-state collaboration of state DD agencies
•
Measures performance of public systems for people
with intellectual and developmental disabilities
•
Assesses performance in several areas, including:
employment, community inclusion, choice, rights, and
health and safety
•
Launched in 1997 in 13 participating states
•
Supported by participating states
•
NASDDDS – HSRI Collaboration
National Core Indicators (NCI)
CT
NCI State Participation 2013-14
OR
MN
UT
CO
KS
MS
TN
SC
WI
MI
IN
V
A
DE
MD
State contract awarded in
2013-14
through AIDD
funding
CA*- Includes
21 Regional Centers
OH
*-
Also includes the Mid-East Ohio Regional Council
39 states, the
District of
Columbia and 22
sub-state regions
ME
WHAT IS NCI?
•
Adult Consumer Survey
In-person conversation with a sample of adults receiving
services to gather information about their experiences
Keyed to important person-centered outcomes that measure
system-level indicators related to: employment, choice,
relationships, case management, inclusion, health, etc.
•
Adult Family, Child Family, and Family/Guardian Surveys
Mail surveys – separate sample from Adult Consumer
Survey
•
Other NCI state level data: Mortality, Staff Stability
National Core Indicators (NCI)
Yearly Outcome Reports
National and State
National Core Indicators (NCI)
Type of Reports
•
Adult Consumer Survey
•
Family Surveys
Adult Family
Family/Guardian
Child Family
•
User Friendly
•
Annual Report
•
Data Briefs
~quarterly
National Core Indicators (NCI)
Limitations to Data
•
NCI
does not
determine acceptable levels of
state performance
•
Be cautious of items with low N’s
•
Some questions change slightly year-to-year
which may impact results
•
Different cohort of states may influence data
National Core Indicators (NCI)
National Reports
Adult Consumer and Family Survey
National Core Indicators (NCI)
Report Format
•
Executive Summary
•
Outcome Results
•
Overview of NCI
•
Survey Development
•
Methodology
•
Appendices
National Core Indicators (NCI)
Adult Consumer Survey
•
Standardized, face-to-face meeting with a sample of
individuals receiving services
Background Information
Section I (no proxies allowed)
Section II (proxies allowed)
•
No pre-screening procedures
•
Conducted with adults only (18 and over) receiving
at least one service in addition to case management
•
Section I and Section II together take 50 minutes (on
average)
•
Overall sample: ~13,000
National Core Indicators (NCI)
Topics Covered
National Core Indicators (NCI)
•
Demographics
•
Individual Outcomes
•
Health, Welfare, and Rights
•
System Performance
Presentation of Demographics
•
Listed alphabetically
by state
•
NCI Average on last
row
•
Shows all response
categories and total
respondents
•
Asterisked (*) items
used for risk-
adjustment
National Core Indicators (NCI)
Presentation of Outcome Data
National Core Indicators (NCI)
Outcomes
National Core Indicators (NCI)
Outcome Charts
National Core Indicators (NCI)
Outcome Tables
Have friends (may be staff or family) and the support needed to see their friends when they
want (‘yes’ responses only)
National Core Indicators (NCI)
Significance and N’s
Have community employment as a goal in their service plan (information
may have been obtained through state records or a proxy respondent)
National Core Indicators (NCI)
Risk Adjustment and Scales:
Choice and Community Inclusion
Chose Home (adjusted)
Entertainment (adjusted)
National Core Indicators (NCI)
Risk Adjustment and Scales:
Choice and Community Inclusion
Life Decisions Scale
Community Inclusion Scale
National Core Indicators (NCI)
Appendices
•
A: How data are recoded/collapsed
•
B: Un-collapsed and Un-adjusted data by
state
•
C: State sample strategy
National Core Indicators (NCI)
Un-collapsed and Un-adjusted data:
Chose Home
National Core Indicators (NCI)
Family Surveys
•
Adult Family Survey
Family of an adult with IDD living in the family
home
•
Family/Guardian Survey
Family/guardian of an adult with IDD living
outside the family home
•
Child Family Survey
Family of child with IDD living in the family
home
National Core Indicators (NCI)
Topics Covered
National Core Indicators (NCI)
•
Information and Planning
•
Choice & Control
•
Access & Support Delivery
•
Community Connections
•
Satisfaction
•
Family Outcomes
Demographics
National Core Indicators (NCI)
Chapter
National Core Indicators (NCI)
Family Outcomes
5 responses
2 responses
National Core Indicators (NCI)
Family Surveys Tables
National Core Indicators (NCI)
Additional Cautions
‘Yes’ is less desired response
‘Don’t know’ response treated
as a ‘No’
•
Respondent knows how
much money is spent by
the IDD agency on family
member
•
Respondent knows how to
file a grievance or
complaint against
providers agencies or staff
•
Respondent knows how to
report abuse and neglect
National Core Indicators (NCI)
State Reports
Adult Consumer and Family Survey
National Core Indicators (NCI)
Consumer Survey
National Core Indicators (NCI)
Family Surveys
National Core Indicators (NCI)
User-Friendly Reports
Consumer and Family Survey
User-Friendly
•
National and State Reports
Adult Consumer Survey
Family Surveys
National Core Indicators (NCI)
Consumer Survey User-Friendly
National Core Indicators (NCI)
Family Survey User-Friendly
National Core Indicators (NCI)
Annual Report
•
At-a-Glance report of major findings
•
Restructured this year
Include more graphics
Review of findings from data briefs and other
articles, presentations, publications
National Core Indicators (NCI)
Data Briefs and Web
Tutorials
Additional Reports
National Core Indicators (NCI)
Data Briefs
•
Data Briefs: highlights of data findings
across states, usually focused on a particular
indicator or group of indicators.
•
Designed to spark your interest and raise
awareness of things we find in the data.
•
Released every 3 months.
Data Briefs
•
Recent topics:
Integrated employment
Racial and ethnic disparities in use of preventive
care health services
Psychotropic drug use
Outcomes for individuals who communicate non-
verbally.
•
Found at:
http://www.nationalcoreindicators.org/resour
ces/data-briefs/
Videos
•
NCI staff are developing video guides that detail how to
use some of our resources
•
Video on how to use the NCI Chart Generator.
•
The Chart Generator:
creates charts using NCI data from the Adult Consumer
Survey
4 years of data available; filter by up to 2 demographic
characteristics
Can look at national average or state specific data.
•
Step by step: how to look at data and create charts that
can help you in your work
•
Available in the top left corner of the Chart Generator
Screen at www.nationalcoreindicators.org/charts
National Core Indicators (NCI)
Videos
•
How to read the survey reports
•
Completed video on how to read Family
Survey Reports. Available on website soon!
•
Upcoming: How to read Adult Consumer
Survey Report
National Core Indicators (NCI)
This set of documents covers various aspects of policy perspectives in Washington, including roles, responsibilities, budget updates, and legislative advocacy activities. It delves into the NDIA Policy Division's activities, liaisons' roles, and the need for policy liaisons in advocating for defense policies.

Download Presentation

Please find below an Image/Link to download the presentation.
The content on the website is provided AS IS for your information and personal use only. It may not be sold, licensed, or shared on other websites without obtaining consent from the author.If you encounter any issues during the download, it is possible that the publisher has removed the file from their server.
You are allowed to download the files provided on this website for personal or commercial use, subject to the condition that they are used lawfully. All files are the property of their respective owners.
The content on the website is provided AS IS for your information and personal use only. It may not be sold, licensed, or shared on other websites without obtaining consent from the author.
E N D
Presentation Transcript
Understanding NCI Reports Sarah Taub NCI Webinar Series April 29th, 2014 National Core Indicators (NCI)
Agenda NCI Overview Review of yearly reports Review of data briefs Review of Website tutorials National Core Indicators (NCI)
WHAT IS NATIONAL CORE INDICATORS (NCI)? Multi-state collaboration of state DD agencies Measures performance of public systems for people with intellectual and developmental disabilities Assesses performance in several areas, including: employment, community inclusion, choice, rights, and health and safety Launched in 1997 in 13 participating states Supported by participating states NASDDDS HSRI Collaboration National Core Indicators (NCI)
NCI State Participation 2013-14 ME NH WA MA MN OR NY WI SD MI CT PA NJ OH* DE MD IN IL UT VA Wash DC CO CA* KS KY MO NC TN OK SC AR AZ NM GA A MS 39 states, the District of Columbia and 22 sub-state regions LA TX FL HI State contract awarded in 2013-14 through AIDD funding CA*- Includes 21 Regional Centers OH*- Also includes the Mid-East Ohio Regional Council
WHAT IS NCI? Adult Consumer Survey In-person conversation with a sample of adults receiving services to gather information about their experiences Keyed to important person-centered outcomes that measure system-level indicators related to: employment, choice, relationships, case management, inclusion, health, etc. Adult Family, Child Family, and Family/Guardian Surveys Mail surveys separate sample from Adult Consumer Survey Other NCI state level data: Mortality, Staff Stability National Core Indicators (NCI)
National and State Yearly Outcome Reports National Core Indicators (NCI)
Type of Reports Adult Consumer Survey Family Surveys Adult Family Family/Guardian Child Family User Friendly Annual Report Data Briefs ~quarterly National Core Indicators (NCI)
Limitations to Data NCI does not determine acceptable levels of state performance Be cautious of items with low N s Some questions change slightly year-to-year which may impact results Different cohort of states may influence data National Core Indicators (NCI)
Adult Consumer and Family Survey National Reports National Core Indicators (NCI)
Report Format Executive Summary Outcome Results Overview of NCI Survey Development Methodology Appendices National Core Indicators (NCI)
Adult Consumer Survey Standardized, face-to-face meeting with a sample of individuals receiving services Background Information Section I (no proxies allowed) Section II (proxies allowed) No pre-screening procedures Conducted with adults only (18 and over) receiving at least one service in addition to case management Section I and Section II together take 50 minutes (on average) Overall sample: ~13,000 National Core Indicators (NCI)
Topics Covered Demographics Individual Outcomes Health, Welfare, and Rights System Performance National Core Indicators (NCI)
Presentation of Demographics Listed alphabetically by state NCI Average on last row Shows all response categories and total respondents Asterisked (*) items used for risk- adjustment National Core Indicators (NCI)
Presentation of Outcome Data Relationships People have friends and relationships. There are six Relationship indicators: 1.The proportion of people who have friends and caring relationships with people other than support staff and family members. 2.The proportion of people who have a close friend, someone they can talk to about personal things. 3.The proportion of people who are able to see their (a) families and (b) friends whenever they want. 4.The proportion of people who feel lonely. 5.The proportion of people who can go on a date if they want to. 6.The proportion of people who report they get to help others. Tables 55 through 61 present the results for these six core indicators. Results for the indicators are ordered from highest to the lowest percentages, where higher percentages are more desirable. The corresponding charts show un-collapsed averages. All un-collapsed and unadjusted data frequencies for these survey questions are displayed in Appendix A. National Core Indicators (NCI)
Outcomes National Core Indicators (NCI)
Outcome Charts National Core Indicators (NCI)
Outcome Tables Have friends (may be staff or family) and the support needed to see their friends when they want ( yes responses only) National Core Indicators (NCI)
Significance and Ns Have community employment as a goal in their service plan (information may have been obtained through state records or a proxy respondent) National Core Indicators (NCI)
Risk Adjustment and Scales: Choice and Community Inclusion Chose Home (adjusted) Entertainment (adjusted) National Core Indicators (NCI)
Risk Adjustment and Scales: Choice and Community Inclusion Life Decisions Scale Community Inclusion Scale National Core Indicators (NCI)
Appendices A: How data are recoded/collapsed B: Un-collapsed and Un-adjusted data by state C: State sample strategy National Core Indicators (NCI)
Un-collapsed and Un-adjusted data: Chose Home National Core Indicators (NCI)
Family Surveys Adult Family Survey Family of an adult with IDD living in the family home Family/Guardian Survey Family/guardian of an adult with IDD living outside the family home Child Family Survey Family of child with IDD living in the family home National Core Indicators (NCI)
Topics Covered Information and Planning Choice & Control Access & Support Delivery Community Connections Satisfaction Family Outcomes National Core Indicators (NCI)
Demographics National Core Indicators (NCI)
Chapter National Core Indicators (NCI)
Family Outcomes 5 responses 2 responses National Core Indicators (NCI)
Family Surveys Tables National Core Indicators (NCI)
Additional Cautions Don t know response treated as a No Respondent knows how much money is spent by the IDD agency on family member Respondent knows how to file a grievance or complaint against providers agencies or staff Respondent knows how to report abuse and neglect Yes is less desired response National Core Indicators (NCI)
Adult Consumer and Family Survey State Reports National Core Indicators (NCI)
Consumer Survey National Core Indicators (NCI)
Family Surveys National Core Indicators (NCI)
Consumer and Family Survey User-Friendly Reports
User-Friendly National and State Reports Adult Consumer Survey Family Surveys National Core Indicators (NCI)
Consumer Survey User-Friendly National Core Indicators (NCI)
Family Survey User-Friendly National Core Indicators (NCI)
Annual Report At-a-Glance report of major findings Restructured this year Include more graphics Review of findings from data briefs and other articles, presentations, publications National Core Indicators (NCI)
Additional Reports Data Briefs and Web Tutorials National Core Indicators (NCI)
Data Briefs Data Briefs: highlights of data findings across states, usually focused on a particular indicator or group of indicators. Designed to spark your interest and raise awareness of things we find in the data. Released every 3 months.
Data Briefs Recent topics: Integrated employment Racial and ethnic disparities in use of preventive care health services Psychotropic drug use Outcomes for individuals who communicate non- verbally. Found at: http://www.nationalcoreindicators.org/resour ces/data-briefs/
Videos NCI staff are developing video guides that detail how to use some of our resources Video on how to use the NCI Chart Generator. The Chart Generator: creates charts using NCI data from the Adult Consumer Survey 4 years of data available; filter by up to 2 demographic characteristics Can look at national average or state specific data. Step by step: how to look at data and create charts that can help you in your work Available in the top left corner of the Chart Generator Screen at www.nationalcoreindicators.org/charts National Core Indicators (NCI)
Videos How to read the survey reports Completed video on how to read Family Survey Reports. Available on website soon! Upcoming: How to read Adult Consumer Survey Report National Core Indicators (NCI)