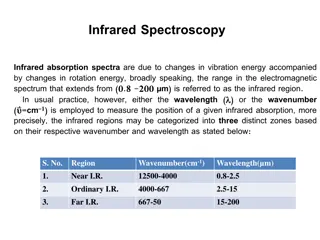
Infrared Spectroscopy: From Molecules to Energy Absorption
Delve into the world of infrared spectroscopy, exploring the electromagnetic spectrum, vibrational energy, and molecular interactions in the gas and liquid phases. Discover why certain molecules absorb infrared energy while others don't, and learn about the significance of greenhouse gases in trapping heat. Gain insights into the rules and guidelines for interpreting IR spectra, making peak assignments, and identifying functional groups.

Download Presentation

Please find below an Image/Link to download the presentation.
The content on the website is provided AS IS for your information and personal use only. It may not be sold, licensed, or shared on other websites without obtaining consent from the author.If you encounter any issues during the download, it is possible that the publisher has removed the file from their server.
You are allowed to download the files provided on this website for personal or commercial use, subject to the condition that they are used lawfully. All files are the property of their respective owners.
The content on the website is provided AS IS for your information and personal use only. It may not be sold, licensed, or shared on other websites without obtaining consent from the author.
E N D
Presentation Transcript
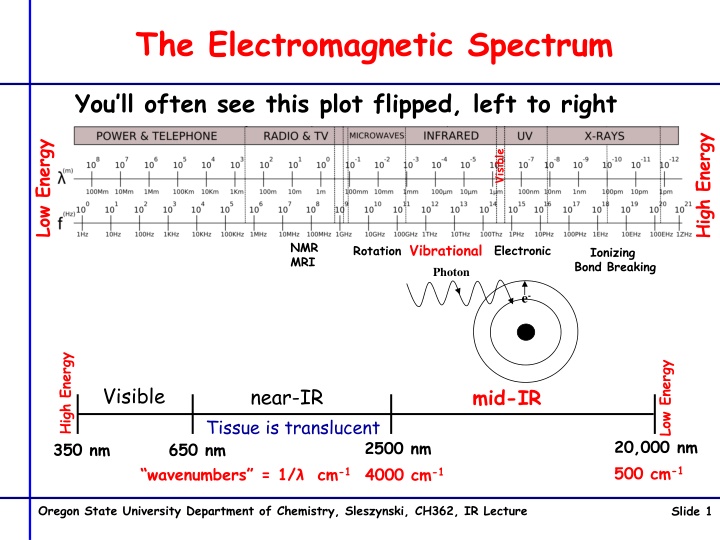
The Electromagnetic Spectrum You ll often see this plot flipped, left to right High Energy Low Energy Visible NMR MRI Vibrational Electronic Rotation Ionizing Bond Breaking Photon e- High Energy Low Energy Visible near-IR mid-IR Tissue is translucent 20,000 nm 500 cm-1 2500 nm 4000 cm-1 350 nm 650 nm wavenumbers = 1/ cm-1 Oregon State University Department of Chemistry, Sleszynski, CH362, IR Lecture Slide 1
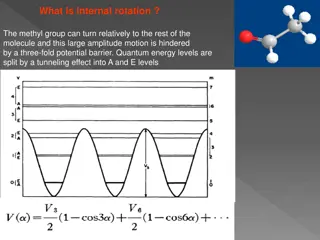
Bond Distance and Vibrational Energy Standard Bonding Representation Cl H Cl H ~Harmonic oscillator math Vibrational energy IR photons @ absolute zero all motion stops H Cl Cl H Cl H pos Energy Infrared spectrum of HCl gas neg 0 Distance Vibrational quantum levels Bond energy Bond distance 17 17 Cl Cl vs 35 37 Quantized! = 1/(2 ) k/m : frequency k: force constant (measure of bond stiffness) single < double < triple m: reduced mass m1m2/m1+m2 1 / (cm-1) https://www.azom.com/article.aspx?ArticleID=15226 Why start with a gas phase IR spectra??? Oregon State University Department of Chemistry, Sleszynski, CH362, IR Lecture Slide 2
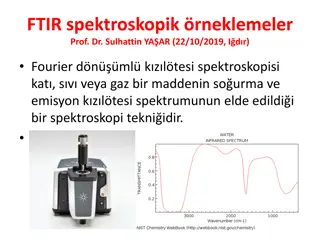
Why P-Chemists Use the Gas Phase: Ideal Gas Law Assumptions H2O gas phase H2O liquid phase Hydrogen bonded H-O H-O In the gas phase molecules do not interact (assumption) pure individual molecular vibrations In the liquid phase molecules are touching molecular vibrations are modified (change in energy) by interactions with neighboring molecules In water the highest energy intermolecular interaction is???? Oregon State University Department of Chemistry, Sleszynski, CH362, IR Lecture Slide 3
What Determines Which Molecules Absorb Infrared Energy? H2, N2, O2 do not absorb infrared energy And CO2, H2O and CH4 all absorb IR? Why? All greenhouse gases!! Absorbing an IR photon must change the atomic positions in a way that results in a change in the molecular dipole moment H2, N2, O2cannot have a dipole Water does . H H H H H H O Rocking 1 O Bending In-plane scissoring O Stretching symmetric H H H H H H O Rocking 2 O Twisting O Stretching asymmetric Or simultaneous combinations of the above Oregon State University Department of Chemistry, Sleszynski, CH362, IR Lecture Slide 4
IR Assignment Rules Actually More Guidelines Than Rules Fingerprint region difficult to make individual peak assignments but useful if you have a reference spectra for comparison Group Region useful for identifying functional groups C C C N High Energy Low Energy http://opening.download/spring-opening.html Oregon State University Department of Chemistry, Sleszynski, CH362, IR Lecture Slide 5
Single Beam IR with No Background Subtraction Source and detector variation with wavelength H2O vapor H2O vapor CO2 gas Oregon State University Department of Chemistry, Sleszynski, CH362, IR Lecture Slide 6
A Series of Benzene Derivative IR Spectra H-O =C-H C=C C=C -C-H <3000 >3000 =C-H -C-H H-O C=O =C-H C=O C=C Oregon State University Department of Chemistry, Sleszynski, CH362, IR Lecture Slide 7
Building a Spectrophotometer In the UV/Visible region wavelength selection is accomplished with a monochrometer Sample Cuvette Monochromator Broad Band White Light Source Dispersed Into Discreet Wavelengths Slit Isolates Desired Wavelength Photomultiplier (PMT) or Silicon Photodiode Detector The original dispersive IRs had a reasonable similar design And then came the Michelson Interferometer Oregon State University Department of Chemistry, Sleszynski, CH362, IR Lecture Slide 8
A Michelson Interferometer Uses Constructive/Destructive Interference d1 = d2 Constructive interference d1 What happens if we start moving one of the mirrors? d2 d1 = d2 - Destructive interference Shift wavelength https://www.mpoweruk.com/figs/Michelson-Interferometer.htm The frequency (cycles/s) of the switch between constructive/destructive = mirror velocity * 1/ The Laser Interferometer Gravitational-Wave Observatory (LIGO) uses an interferometer that is 4 kilometers long to detect gravitational waves Oregon State University Department of Chemistry, Sleszynski, CH362, IR Lecture Slide 9
The Interferogram: All Wavelengths Simultaneously Each wavelength alternates between constructive & destructive interference 2.5 1 2 1.5 1 But in a different time sequence 0.5 0 0 10 20 30 40 50 An Interferogram is the result 2.5 1 & 2 2 1.5 1 0.5 0 0 10 20 30 40 50 What the detector sees 1 + 2 5 4 3 2 1 0 0 10 20 30 40 50 https://www.newport.com/n/introduction-to-ftir-spectroscopy Oregon State University Department of Chemistry, Sleszynski, CH362, IR Lecture Slide 10
Interferogram is Time Domain Spectra is Frequency Domain https://www.newport.com/n/introduction-to-ftir- spectroscopy How do we get from an Interferogram in the time domain To a spectra in the frequency domain? Fourier transform math f(frequency) = f(time) + i2 t f( ) = f(t)e dt - Oregon State University Department of Chemistry, Sleszynski, CH362, IR Lecture Slide 11
Do not all fixd Bodies, when heated beyond a certain degree, emit Light and shine; and is not this Emission perform d by the vibrating motion of its parts? Isaac Newton, Opticks, published 1704. IR Sources are Planck Black Body Radiators Without thinking, which is hotter? Red hot or white hot? What temperature range would give us photons in the mid-IR range? Nernst Glower: heated rare earth oxide ~1500 K Spectra output 1-50 um Globar: heated silicon carbide ~1500 K Spectra output 1-50 um Oregon State University Department of Chemistry, Sleszynski, CH362, IR Lecture Slide 12
IR Detectors Visible photons are energetic and in semi- conductors will kick electrons out of valence bands and into conduction bands, producing a current Mercury Cadmium Telluride (MCT) is an IR photon sensitive semiconductor which must be liquid N2 cooled Pyroelectric detectors deuterated triglycine sulfate detector (DTGS) - work based on temperature differences D* is a measure of sensitivity Oregon State University Department of Chemistry, Sleszynski, CH362, IR Lecture Slide 13
Refractive Index The speed of light a constant 3.00 x 10⁸ m/s Slower in denser material Refractive index n = c = speed in a vacuum v speed in media in a vacuum vacuum n = 1 water n = 1.33 n1 > n2 n2 2 Critical Angle 2 Snell s Law n1 = sin 2 n2 sin 1 n1 1 Fiber optics 1 1 Refractive index is related to density Concentration 10% Glucose solution in water 20% Glucose solution in water 60% Glucose solution in water Index 1.3477 1.3635 1.4394 Oregon State University Department of Chemistry, Sleszynski, CH362, IR Lecture Slide 14
Refractometry and Instrument Design Visible http://www.refractometer.pl/Abbe-refractometer Oregon State University Department of Chemistry, Sleszynski, CH362, IR Lecture Slide 15