Influence of Solar Activity and Orbital Motion on Terrestrial Atmosphere
Solar magnetic field reversal, wavelet spectral analysis, and proxies for solar activity index are discussed in relation to the joint effects of solar activity and solar orbital motion on the Earth's atmosphere. The study highlights the impact of solar cycles on terrestrial climate dynamics and temperature variations, projecting a decrease in temperature following the Sun entering a grand solar minimum until 2053. Observational results and dynamo models further support the findings.
Download Presentation

Please find below an Image/Link to download the presentation.
The content on the website is provided AS IS for your information and personal use only. It may not be sold, licensed, or shared on other websites without obtaining consent from the author.If you encounter any issues during the download, it is possible that the publisher has removed the file from their server.
You are allowed to download the files provided on this website for personal or commercial use, subject to the condition that they are used lawfully. All files are the property of their respective owners.
The content on the website is provided AS IS for your information and personal use only. It may not be sold, licensed, or shared on other websites without obtaining consent from the author.
E N D
Presentation Transcript
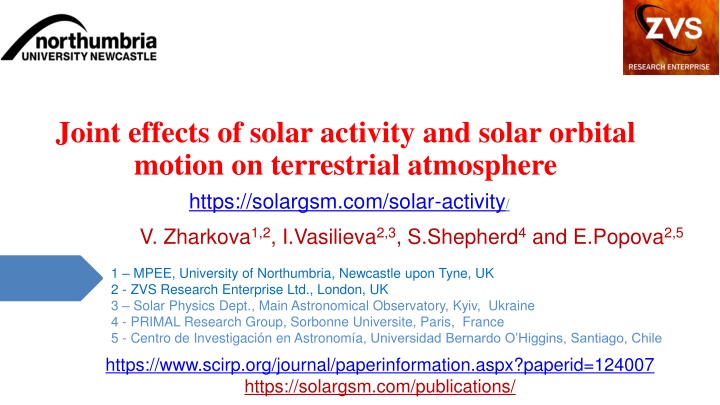
Joint effects of solar activity and solar orbital motion on terrestrial atmosphere https://solargsm.com/solar-activity/ V. Zharkova1,2, I.Vasilieva2,3, S.Shepherd4 and E.Popova2,5 1 MPEE, University of Northumbria, Newcastle upon Tyne, UK 2 - ZVS Research Enterprise Ltd., London, UK 3 Solar Physics Dept., Main Astronomical Observatory, Kyiv, Ukraine 4 - PRIMAL Research Group, Sorbonne Universite, Paris, France 5 - Centro de Investigaci n en Astronom a, Universidad Bernardo O Higgins, Santiago, Chile https://www.scirp.org/journal/paperinformation.aspx?paperid=124007 https://solargsm.com/publications/
Solar magnetic field reversal Strong toroidal magnetic fields (TMF) forming Active Regions (ARs) are created in a shear layer beneath the base of the Solar Convection zone (SCZ).
Wavelet spectral analysis of SSN 10.7 and 101 years Averaged sunspot numbers SSN Wavelet analysis Global wavelet spectrum black solid line Fourier spectrum indigo 95% CI black dashed line Axis Y: Main periods 10.7 and 101 years Period of 50-55 years lower than a red noise level (red dotted line)
2-1. New proxy for solar activity index two largest eigen vectors of SBMF (blue and red lines) and their summary curve (black line) Fitting the PCs to measured in cycle 24 and prediction to 25-26 Zharkova et al, 2015 https://www.nature.com/articles/srep15689
2-2. Modulus summary curve vs sunspot numbers SSN Zharkova et al, 2015, SciRep; 2020, Temp., Zharkova et al, 2022, MNRAS s sunsdata (Shepherd et al, 2014 ; Zharkova et al, 2015) Cycle 23 Cycle 22 Cycle 21 Confirmed by Katiashvili, 2020, ApJ; Obridko et al, 2021, MNRAS Velasco-Herrera et al, 2021 Cycle 23 Cycle 24 Cycle 21 Cycle 25 Cycle 22 Cycle 26
Wavelet spectral analysis of MSC Modulus summary curve of two largest eigen vectors (dipole MF) Global wavelet spectrum black solid line Fourier spectrum indigo 95% CI black dashed line Main periods 21.5 and 344 years
In 2020 the Sun entered the grand solar minimum to last until 2053 not increase but decrease of temperature up to 1C Observational result, dynamo model was not yet considered https://www.nature.com/articles/srep15689) https://solargsm.com/solar-activity/ - my webpage
Solar irradiance and terrestrial temperature during MM Lamb, 1972; Easterbrook, 2016 Lean et al, 1995, JGR S, Maunder minimum, W/m2 1363 1364 --- --- --- Authors S 1990-2000, W/m2 S from MM, % Lean et. Al., 1995 Steinhilber et al, 2012 Shirley et al., 1990 Wolff and Hickey, 1987 Lee et al., 1995 1366 1366 1370 1371 1372 0.22 0.22 0.51 0.51 0.51 After the TSI data were re-normalized the old data are hardly usable
Temperature restoration during/after MM (Shindell et al., 2001, Science) The surface temperature of the Earth was reduced all over the Globe Europe and North America went into a deep freeze Alpine glaciers extended over valley farmland Sea ice crept south from the Arctic Danube and Thames rivers & canals in the Netherlands froze regularly
Hallstatts cycle - Wavelet spectral analysis of TSI (14C+10Be) TSI by Steinhilber et al, 2012 TSI by Vieira et al, 2011 Main periods 10.7, 216, 363 and 2243-2300 years (Hallstatt s cycle)
Solar magnetic field (top) and Mbaseline oscillations (bottom) (ZharkovlZharkova et., 2019, 2021al, 2018, 2019, 220 ture SR) Reames et al, 2009 14C in trees (Hallstatt s cycle)
Modern Hallstatts cycle (Zharkova et al, 2019, 2020) MF baseline coincides with solar irradiance (Vierra et al, 2011) and T (Akasofu, 2011) Zharkova et al, 2019, 2020
Zharkova et al, 2023 2020 Aphelion . 5 July Perihelion 5 January https://www.scirp.org/journal/paperinformation.aspx?paperid=124007 2600 Aphelion . 16 July Perihelion 16 January SIM effects on the Earth via solar irradiance https://youtu.be/vDgUmTq4a2Q Solar Inertial Motion S. Perminov, E.D. Kuznetsov, 2018 SIM imposed by planets Jupiter, Saturn, Neptune and Uranus Charvatova, 1988, Palus et al, 2007 Rice et al, PP comments #72, 96
Variations of the total annual TSI in M1 (600-1600) and M2 (1600-2600) taken from the TSI averaged for each month (left) and daily TSI (right) https://arxiv.org/pdf/2008.00439.pdf Zharkova et al, 2019, Zharkova, 2020 Extra solar forcing Not considered so far! Extra 5 W/m2 of TSI, 60% warming comes to Sun, 40% - to green house gasses (Hardy, 2017). We have found extra TSI of 20 W/m2 in 2020! It will last until 2500!
Solar inertial motion effects Period of 2100-2200 years Solar dynamo effects: a) two double dynamo 11 year waves b) grand solar cycles & GSMs wave beating increase of T by 1.5C by 2100, and by further by 2.5-3.0 C by 2500 interrupted by T decreases during GSMs . During GSMs: a decrease of temperature up to 1C
Conclusions Solar activity is defined by action of solar dynamo converting solar poloidal (background) into toroidal (sunspot) magnetic fields and vice versa during the period of 10.7 years Solar dynamo acts in two layers with different speed of meridional circulation as derived from the summary curve of eigen vectors varying with the periods of 21.5 years (magnetic solar cycle) and 344-350 years (grand solar cycle) Spectral analysis of the TSI variations reveals the periods 2243 -2300 years (wavelet+Fourier) Hallstatt s cycles The baseline of the summary curve of SBMF also reveals weak variations with a period of ~2100- 2200 years Hallstatt s cycle Hallstatt s cycle variations are closely linked to the solar inertial motion (SIM) about the barycentre of the solar system the ephemeris of S-E distances shown A change of S-E distances from 1600 to 2500 leads to the TSI increase by 20-25 W/m2 per year (10-12 W/m2 per hemisphere) Increase of TSI with a decrease of S-E distances (SIM) leads to the increase of T by 1.5C by 2100, and by further by 2.5-3.0 C by 2500. The increases of terrestrial temperature will be interrupted by the decreases by 1C during two GSMs (2020-2053 and 2375-2415) caused by large reduction of solar activity.
