An overview of solar influence on climate


An overview of solar influence on climate
Indrani Roy

Few points on solar climate relationship
•
The Sun is principal source of energy in the earth- causes
day/night and seasons-
reasons to believe solar variability
can influence climate.
•
11 year solar variability is important one as it can be used for
prediction purpose.
•
In terms of energy output only .1 % change from max to min
years of 11 year cycle –
too negligible to influence climate.
•
W
h
y
r
e
g
i
o
n
a
l
l
y
d
i
f
f
e
r
e
n
t
?
S
o
m
e
r
e
g
i
o
n
s
i
g
n
i
f
i
c
a
n
t
a
n
d
a
l
s
o
d
e
p
e
n
d
s
o
n
t
i
m
e
p
e
r
i
o
d
.
U
n
l
e
s
s
a
n
y
m
e
c
h
a
n
i
s
m
t
o
s
u
p
p
o
r
t
i
t
c
a
n
b
e
c
o
i
n
c
i
d
e
n
c
e
.
H
o
l
i
s
t
i
c
r
e
p
r
e
s
e
n
t
a
t
i
o
n
o
f
s
o
l
a
r
1
1
y
e
a
r
c
y
c
l
e
o
n
c
l
i
m
a
t
e
Outline
•
Background
•
Troposphere - Stratosphere Coupling
Role of
Sun
Role of
Sun
+QBO
•
Atmosphere - Ocean Coupling
Role of
Sun+QBO
+ENSO
Role of
Sun+QBO+ENSO
+Climate change
•
Summary
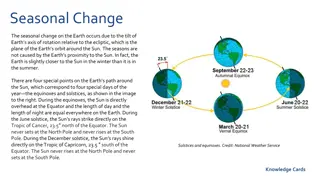
Background: Climatology - SLP
Climatology: SST
General Circulation
•
Three cells and jet in between
•
Midlattitude Ferrel cell
•
Midlatitude cyclone and anti
Cyclones are major eddies there
and they transport heat poleward.
Background: Stratosphere-troposphere
coupling
1
.
B
a
c
k
g
r
o
u
n
d
f
l
o
w
i
s
W
l
y
and not too strong
a
n
d
2
.
L
o
n
g
w
a
v
e
s
(wave no. 1 or 2)
Westerlies
in mid to high latitudes
Winter
Northern Hemisphere
In mid-latitudes
orography
and land-sea temperature
contrasts generate long
Rossby waves in troposphere.
C
h
a
r
n
e
y
D
r
a
z
e
n
C
r
i
t
e
r
i
a
:
stationary waves propagate
only if:
Schematic Representation
(
C
I
R
A
c
l
i
m
a
t
o
l
o
g
y
,
F
l
e
m
i
n
g
e
t
a
l
.
,
1
9
9
0
)
M
e
r
i
d
i
o
n
a
l
t
e
m
p
e
r
a
t
u
r
e
g
r
a
d
i
e
n
t
s
e
t
s
u
p
w
e
s
t
e
r
l
y
j
e
t
i
n
w
i
n
t
e
r
s
t
r
a
t
o
s
p
h
e
r
e
P
l
a
n
e
t
a
r
y
–
s
c
a
l
e
w
a
v
e
s
(
P
W
)
p
r
o
p
a
g
a
t
e
u
p
w
a
r
d
s
u
n
d
e
r
W
l
y
f
l
o
w
i
n
w
i
n
t
e
r
h
e
m
i
s
p
h
e
r
e
P
W
s
g
r
o
w
a
n
d
b
r
e
a
k
:
d
e
c
e
l
e
r
a
t
i
n
g
w
e
s
t
e
r
l
i
e
s
a
n
d
w
a
r
m
i
n
g
p
o
l
e
.
P
W
p
r
o
p
a
g
a
t
i
o
n
i
s
s
e
n
s
i
t
i
v
e
t
o
:
1.
S
t
r
e
n
g
t
h
o
f
w
e
s
t
e
r
l
i
e
s
–
S
o
l
a
r
i
n
f
l
u
e
n
c
e
2.
L
o
c
a
t
i
o
n
o
f
z
e
r
o
w
i
n
d
l
i
n
e
-
Q
B
O
i
n
f
l
u
e
n
c
e
Z
e
r
o
w
i
n
d
l
i
n
e
R
o
l
e
o
f
z
e
r
o
w
i
n
d
l
i
n
e
:
Q
B
O
i
n
f
l
u
e
n
c
e
Mechanism:
1
.
D
u
r
i
n
g
E
-
l
y
Q
B
O
,
z
e
r
o
-
w
i
n
d
l
i
n
e
m
o
v
e
s
t
o
s
u
b
t
r
o
p
i
c
s
o
f
t
h
e
w
i
n
t
e
r
h
e
m
i
s
p
h
e
r
e
2
.
I
t
n
a
r
r
o
w
s
w
i
d
t
h
o
f
p
l
a
n
e
t
a
r
y
w
a
v
e
-
g
u
i
d
e
3.
P
l
a
n
e
t
a
r
y
w
a
v
e
s
r
e
d
i
r
e
c
t
e
d
p
o
l
e
w
a
r
d
s
4
.
W
h
e
n
s
u
c
h
w
a
v
e
e
v
e
n
t
s
w
i
t
h
l
a
r
g
e
a
m
p
l
i
t
u
d
e
b
r
e
a
k
o
r
d
i
s
s
i
p
a
t
e
t
h
e
y
w
a
r
m
p
o
l
a
r
s
t
r
a
t
o
s
p
h
e
r
e
.
z
o
n
a
l
m
e
a
n
w
i
n
d
d
i
f
f
e
r
e
n
c
e
s
Holton-Tan Effect:
QBO Ely - warmer pole
10
Multiple Regression Analysis
S
S
N
P
o
l
e
-
w
a
r
d
s
h
i
f
t
&
w
e
a
k
e
n
i
n
g
o
f
S
T
J
Sun via Lower stratosphere
(C-F)
(
-
)
(
-
)
Δ
S
o
l
a
r
(Decadal)
(Decadal)
Δ
F
e
r
r
e
l
c
e
l
l
C
E
F
Atmosphere only
Δ
H
a
d
l
e
y
c
e
l
l
W
a
r
m
i
n
g
t
r
o
p
i
c
a
l
l
o
w
e
r
s
t
r
a
t
o
s
p
h
e
r
e
D
D, E, F: Haigh (2005, 2006), Brönnimann (2006)
C: Haigh (1996), Gray and Frame (2010)
O
b
s
e
r
v
a
t
i
o
n
a
l
(
D
,
E
,
F
)
:
H
a
i
g
h
M
o
d
e
l
(
D
,
E
,
F
)
:
H
a
i
g
h
O
b
s
e
r
v
a
t
i
o
n
a
l
(
C
)
:
G
r
a
y
a
n
d
F
r
a
m
e
(
2
0
1
0
)
Δ
T
r
a
d
e
w
i
n
d
(
D
J
F
)
P
o
l
e
-
w
a
r
d
s
h
i
f
t
&
w
e
a
k
e
n
i
n
g
o
f
S
T
J
Atmosphere only: Sun via Lower stratosphere
a
n
d
m
i
d
-
l
a
t
i
t
u
d
e
o
f
P
a
c
i
f
i
c
(
C
-
H
)
(
-
)
(
-
)
I
n
f
l
u
e
n
c
e
A
L
a
n
d
P
H
(
D
J
F
)
Δ
S
o
l
a
r
(
(
D
D
e
e
c
c
a
a
d
d
a
a
l
l
)
)
Δ
F
e
r
r
e
l
c
e
l
l
E
F
H
(
+
)
G
Δ
H
a
d
l
e
y
c
e
l
l
W
a
r
m
i
n
g
t
r
o
p
i
c
a
l
l
o
w
e
r
s
t
r
a
t
o
s
p
h
e
r
e
D
G: Christoforou and Hameed (1997);
H, G: Our result (Regression)
C
C
l
o
u
d
f
r
e
e
M
i
d
l
a
t
i
t
u
d
e
o
f
P
a
c
i
f
i
c
D
1
C
1
C
1
, D
1
: Meehl et al (2008)
Aleutian Low(AL) and Pacific High (PH)
C
h
r
i
s
t
o
f
o
r
o
u
a
n
d
H
a
m
e
e
d
,
1
9
9
7
(
G
)
R
e
s
u
l
t
S
o
l
a
r
(
H
,
G
)
:
R
e
g
r
e
s
s
i
o
n
(
D
J
F
)
‘
B
o
t
t
o
m
u
p
’
M
e
c
h
a
n
i
s
m
:
M
e
e
h
l
e
t
a
l
,
2
0
0
8
(
C
1
,
D
1
)
‘Bottom up’ suggests :
•
More solar radiation through cloud free mid-latitude of pacific in active
solar years.
•
Increased latent heat flux, increased moisture convergence –strengthen
trade wind.
I
n
t
e
n
s
i
f
i
c
a
t
i
o
n
o
f
P
J
Δ
P
o
l
a
r
V
o
r
t
e
x
Δ
S
o
l
a
r
(Decadal)
(Decadal)
Δ
A
A
O
Δ
A
O
(
+
)
A
J
K
Atmosphere only: Sun and Polar vortex
(A, I-K)
I
(
+
)
(
+
)
A, I : Usual mechanism following
thermal wind balance
J, K : Baldwin (2005);
Our result (Regression)
NAM at 1000 hPa and 10 hPa for Nov-Apr ,1958-2000
A
n
n
u
l
a
r
M
o
d
e
s
p
a
t
t
e
r
n
s
i
m
i
l
a
r
(
J
,
K
)
-
B
a
l
d
w
i
n
a
n
d
D
u
n
k
e
r
t
o
n
(
2
0
0
5
)
R
e
g
r
e
s
s
i
o
n
:
S
o
l
a
r
s
i
g
n
a
l
i
n
p
o
l
a
r
m
o
d
e
s
(
J
,
K
)
•
Both AO and AAO signal is seen during 1856-1957
•
AAO signal is seen in JJA even for whole 150 yr period (1856-2004)
•
Using different TSI, the result is similar for solar cycle variability
SSN(JJA)1856-2004
SSN (Annually) 1856-1957
Atmosphere only: Sun, polar vortex and lower stratosphere
B: Kodera and Kuroda (2002)
B
(
B
.
D
.
C
i
r
c
u
l
a
t
i
o
n
)
(
F
i
g
:
K
o
d
e
r
a
a
n
d
K
u
r
o
d
a
,
2
0
0
2
)
S
o
l
a
r
i
n
f
l
u
e
n
c
e
:
P
o
l
a
r
v
o
r
t
e
x
a
n
d
l
o
w
e
r
s
t
r
a
t
o
s
p
h
e
r
e
(
B
)
Solar UV at 205 nm
increases ~6% from
solar min to solar max
This influences the path of
upward propagating planetary
waves which deposit their zonal
momentum on the poleward
side of the jet.
More ozone heating
in upper stratosphere
alters temperature
and wind structure
Solar heating anomalies
also change the strength
of polar stratospheric jet (U)
S
t
r
a
t
o
s
p
h
e
r
e
-
T
r
o
p
o
s
p
h
e
r
e
C
o
u
p
l
i
n
g
:
S
u
n
+
Q
B
O
(
A
-
M
)
L, M: our result (Regression)
L
(
-
)
M
(
-
)
Δ
Q
B
O
(
Q
u
a
s
i
-
b
i
a
n
n
u
a
l
O
s
c
i
l
l
a
t
i
o
n
)
Composites of time height
development of NAM
[
B
a
l
d
w
i
n
a
n
d
D
u
n
k
e
r
t
o
n
,
2
0
0
1
]
Perturbation in polar stratosphere can
affect troposphere for next few months
Sun, QBO and Polar
temperature in north pole
[
L
a
b
i
t
z
k
e
a
n
d
v
a
n
L
o
o
n
,
1
9
9
2
]
•
W-ly QBO/ Solar min coldest
•
E-ly QBO/ Solar max also cold
E
l
y
/
S
o
l
M
i
n
W
a
r
m
W
l
y
/
S
o
l
M
a
x
W
a
r
m
E
l
y
/
S
o
l
M
a
x
C
o
l
d
W
l
y
/
S
o
l
M
i
n
C
o
l
d
S
u
n
,
Q
B
O
a
n
d
A
t
m
o
s
p
h
e
r
e
Active sun-westerly QBO and less active sun-easterly QBO both
trigger negative AO and AAO features
Regression of SLP with Solar*QBO(50 hPa):
L,M
-
v
e
A
O
-
v
e
A
A
O
(
-
)
O
c
e
a
n
S
h
a
l
l
o
w
M
O
C
T
h
e
r
m
o
c
l
i
n
e
s
h
i
f
t
i
n
g
(
+
)
(
+
)
Q
Δ
E
N
S
O
(
i
n
t
e
r
-
a
n
n
u
a
l
)
O
1
N
.
P
a
c
i
f
i
c
w
a
r
m
i
n
g
(
+
)
P
Ocean Coupling (Pacific)
Global ocean Conveyor belt:
Connect mid-latitude of Pacific to tropics
Walker circulation
Cold Event of ENSO
Niño SST and Thermocline slope interconnected
Volume transport convergence and SST averaged over eastern tropical Pacific
Δ
Walker cell
Δ
Trade wind
(DJF)
Pole-ward shift &
weakening of STJ
(+)
(-)
(-)
A
t
m
o
s
p
h
e
r
e
O
c
e
a
n
(-)
(-)
N
S
Shallow
MOC
Thermocline
shifting
(+)
(+)
Influence AL and
PH (DJF)
Intensification
of PJ
Δ
Polar
Vortex
Q
(B.D. Circulation)
Δ
S
o
l
a
r
(Decadal)
(Decadal)
Δ
Q
B
O
(Quasi-biannual)
Δ
E
N
S
O
(inter-annual)
Δ
AAO
Δ
AO
(+)
(-)
(B.D. Circulation)
Δ
Ferrel cell
A
C
E
F
+
H
O
1
O
2
R
J
K
L
M
N. Pacific
warming
(+)
(+)
G
1
P
G
2
A
t
m
o
s
p
h
e
r
e
-
O
c
e
a
n
(
P
a
c
i
f
i
c
)
C
o
u
p
l
i
n
g
:
S
u
n
+
Q
B
O
+
E
N
S
O
(
A
-
S
)
B
I
Δ
Hadley cell
Warming
tropical
lower
stratosphere
D
(+)
(+)
N, O
2
: Usual ENSO mechanism
S:
Carvalho et al., 2005
R: Camp and Tung (2007),
Thompson and Baldwin (2001)
G
2
: Our result (Regression)
C
Cloud free
Midlatitude
of Pacific
D
1
C
1
E
N
S
O
a
n
d
J
E
T
:
C
a
r
v
a
l
h
o
e
t
a
l
.
,
2
0
0
5
(
S
)
•
Cold ENSO are linked with dominant positive AAO and vice versa
•
AAO phases are allied with latitudinal migration of STJ and intensity
of mid-latitude polar jet
Negative AAO phase
Positive AAO phase
Negative-Positive
Zonal wind (200 hPa)
P
o
l
a
r
v
o
r
t
e
x
a
n
d
E
N
S
O
(
R
)
:
T
h
o
m
p
s
o
n
a
n
d
B
a
l
d
w
i
n
(
2
0
0
1
)
(
W
e
a
k
-
s
t
r
o
n
g
v
o
r
t
e
x
)
R
e
g
r
e
s
s
i
o
n
:
M
i
d
-
l
a
t
i
t
u
d
e
w
a
r
m
i
n
g
(
G
2
)
•
Strong decrease in strength of shallow meridional overturning circulation
(MOC) around tropical Pacific after 1950s
•
Modest intensification since 1998
•
Also true for Walker and Hadley circulation; more in Walker.
(McPhaden and Zhang,2004;Vecchi and Soden 2007)
N
a
t
u
r
e
o
f
E
N
S
O
w
a
s
d
i
f
f
e
r
e
n
t
b
e
f
o
r
e
1
9
5
0
s
(
a
n
d
a
f
t
e
r
1
9
9
7
)
Could change in ocean and atmosphere circulation due to climate change
during that period have modified the solar- ENSO behaviour?
S
u
n
S
p
o
t
N
u
m
b
e
r
S
u
n
S
p
o
t
N
u
m
b
e
r
(
1
9
5
8
-
1
9
9
7
)
(
1
8
5
6
-
1
9
5
7
)
&
(
1
9
9
8
-
2
0
0
7
)
E
N
S
O
(
D
J
F
)
E
N
S
O
(
D
J
F
)
Δ
Walker cell
Δ
Trade wind
(DJF)
Pole-ward shift &
weakening of STJ
C
l
i
m
a
t
e
C
h
a
n
g
e
(2
nd
half of
20th century)
(+)
(
-
)
(-)
(-)
A
t
m
o
s
p
h
e
r
e
O
c
e
a
n
(
-
)
(-)
(-)
N
S
Shallow
MOC
(
-
)
Thermocline
shifting
(
+
)
(+)
(
-
)
(+)
Influence AL and
PH (DJF)
Intensification
of PJ
Δ
Polar
Vortex
Q
W
(B.D. Circulation)
X
Δ
S
o
l
a
r
(Decadal)
(Decadal)
Δ
Q
B
O
(Quasi-biannual)
Δ
E
N
S
O
(inter-annual)
Δ
AAO
Δ
AO
(+)
(-)
(B.D. Circulation)
Δ
Ferrel cell
A
C
E
F
+
H
O
1
O
2
R
J
K
L
M
U
T
V
1
N. Pacific
warming
(+)
V
2
(+)
G
1
P
G
2
Z
A
t
m
o
s
p
h
e
r
e
-
O
c
e
a
n
C
o
u
p
l
i
n
g
:
S
u
n
+
Q
B
O
+
E
N
S
O
+
C
l
i
m
a
t
e
c
h
a
n
g
e
(
A
-
Z
)
B
I
Δ
Hadley cell
Warming
tropical
lower
stratosphere
D
(+)
(+)
U, T, W : (McPhaden and Zhang,2004;
Vecchi, et al. 2007)
Y
V
1
, V
2
: Usual ENSO mechanism
V
1
: Our result (Regression)
X, Z : Our result (Regression)
Cloud free
Midlatitude
of Pacific
D
1
C
1
1958-1997 (
DJF
)
1856-1957(
DJF
)
Solar Signal was different during 1958-1997
(X,Z,V
1
)
•
N
o
s
o
l
a
r
s
i
g
n
a
l
i
s
s
e
e
n
a
r
o
u
n
d
I
T
C
Z
o
f
e
a
s
t
e
r
n
P
a
c
i
f
i
c
d
u
r
i
n
g
l
a
t
e
r
p
e
r
i
o
d
•
Signal around AL weakened
W
e
a
r
e
i
n
t
e
r
e
s
t
e
d
Solar Signal on Tropical Pacific SST during 1958-1997
(V
1
)
But ..
•
No signal when ENSO is included in regression.
•
Also suggests White et al (1997) may not be true in earlier period.
Regression (SSN) for SST
White et al. (1997)
•
Warming in tropical E. Pacific after 1950s, follows White et al, (1997)
Solar signal during 1958-1997 is also different in polar modes
•
Pathways R and S may be potential route to influence polar modes.
•
Using different Total Solar Irradiance (TSI), the result is similar.
S
S
N
(
1
8
5
6
-
1
9
5
7
)
S
S
N
(
1
9
5
8
-
1
9
9
7
)
Atmosphere-Ocean coupling (only Pacific)
N
e
x
t
:
I
n
h
o
l
i
s
t
i
c
r
e
p
r
e
s
e
n
t
a
t
i
o
n
i
n
c
l
u
d
e
NAO and Indian summer monsoon
Atlantic and Indian Ocean
Summary
•
Discussed how sun is affecting troposphere.
•
The effect is different in poles, if QBO is included.
•
How ocean and atmosphere are connected.
•
Active sun can influence SST in tropical Pacific though overwhelmed
by strong influence of ENSO at LS period.
Main Points:
•
Proposed an overview how atmosphere and ocean might be affected
by solar variability.
•
How the effect is disturbed during last half of 20th century.
•
Why true quantification of solar signal is so difficult.
Interested in Details
R
o
y
,
I
.
,
2
0
1
3
,
‘
T
h
e
r
o
l
e
o
f
t
h
e
s
u
n
i
n
a
t
m
o
s
p
h
e
r
e
-
o
c
e
a
n
c
o
u
p
l
i
n
g
’
,
I
n
t
e
r
n
a
t
i
o
n
a
l
J
o
u
r
n
a
l
o
f
C
l
i
m
a
t
o
l
o
g
y
,
d
o
i
:
1
0
.
1
0
0
2
/
j
o
c
.
3
7
1
3
.
Atmosphere-Ocean coupling (only Pacific)
The relationship between solar variability and Earth's climate is complex, with factors like the Sun's energy output, 11-year solar cycle, and regional differences playing a role. This overview delves into how solar influences interact with atmospheric and oceanic processes, such as the Sun's impact on the Quasi-Biennial Oscillation (QBO), El Niño-Southern Oscillation (ENSO), and climate change. The dynamics of solar-climate interactions, stratosphere-troposphere coupling, and the Holton-Tan Effect are discussed to provide a holistic understanding of solar effects on climate systems.

Download Presentation

Please find below an Image/Link to download the presentation.
The content on the website is provided AS IS for your information and personal use only. It may not be sold, licensed, or shared on other websites without obtaining consent from the author.If you encounter any issues during the download, it is possible that the publisher has removed the file from their server.
You are allowed to download the files provided on this website for personal or commercial use, subject to the condition that they are used lawfully. All files are the property of their respective owners.
The content on the website is provided AS IS for your information and personal use only. It may not be sold, licensed, or shared on other websites without obtaining consent from the author.
E N D
Presentation Transcript
An overview of solar influence on climate Indrani Roy
Few points on solar climate relationship The Sun is principal source of energy in the earth- causes day/night and seasons- reasons to believe solar variability can influence climate. 11 year solar variability is important one as it can be used for prediction purpose. In terms of energy output only .1 % change from max to min years of 11 year cycle too negligible to influence climate. Why regionally different? Some region significant and also depends on time period.Unless any mechanism to support it can be coincidence. Holistic representation of solar 11 year cycle on climate
Outline Background Troposphere - Stratosphere Coupling Role of Sun Role of Sun +QBO Atmosphere - Ocean Coupling Role of Sun+QBO+ENSO Role of Sun+QBO+ENSO+Climate change Summary
Background: Stratosphere-troposphere coupling Charney Drazen Criteria: stationary waves propagate only if: Winter Northern Hemisphere Westerlies 1. Background flow is W ly and not too strong in mid to high latitudes and 2. Long waves (wave no. 1 or 2) In mid-latitudes orography and land-sea temperature contrasts generate long Rossby waves in troposphere.
Schematic Representation Zero wind line Meridional temperature gradient sets up westerly jet in winter stratosphere Planetary scale waves (PW) propagate upwards under W ly flow in winter hemisphere PWs grow and break: decelerating westerlies and warming pole. PW propagation is sensitive to: (CIRA climatology, Fleming et al., 1990) 1. Strength of westerlies Solar influence 2. Location of zero wind line- QBO influence
Role of zero wind line : QBO influence Mechanism: Holton-Tan Effect: 1. During E-ly QBO, zero-wind line moves to subtropics of the winter hemisphere QBO Ely - warmer pole 2. It narrows width of planetary wave-guide 3. redirected polewards Planetary waves 4. When such wave events with large amplitude break or dissipate they warm polar stratosphere. zonal mean wind differences
Multiple Regression Analysis SSN 10
Atmosphere only Sun via Lower stratosphere (C-F) Warming tropical lower stratosphere (-) C D Hadley cell E Solar (Decadal) (-) Ferrel cell F Pole-ward shift & weakening of STJ C: Haigh (1996), Gray and Frame (2010) D, E, F: Haigh (2005, 2006), Br nnimann (2006)
Observational (C): Gray and Frame (2010) Observational (D,E,F): Haigh Model (D,E,F): Haigh
Atmosphere only: Sun via Lower stratosphere and mid-latitude of Pacific (C-H) Cloud free Midlatitude of Pacific (+) 1 1 Trade wind (DJF) D C Warming tropical lower stratosphere C H D (-) Hadley cell Solar (Decadal) E Influence AL and PH (DJF) Ferrel cell (-) G F Pole-ward shift & weakening of STJ G: Christoforou and Hameed (1997); H, G: Our result (Regression) C1, D1: Meehl et al (2008)
Aleutian Low(AL) and Pacific High (PH) Christoforou and Hameed, 1997 (G) Result Solar (H,G) : Regression (DJF)
Bottom up Mechanism: Meehl et al , 2008 (C1, D1) Bottom up suggests : More solar radiation through cloud free mid-latitude of pacific in active solar years. Increased latent heat flux, increased moisture convergence strengthen trade wind.
Atmosphere only: Sun and Polar vortex (A, I-K) Solar (Decadal) Polar Vortex (+) A A, I : Usual mechanism following thermal wind balance I J, K : Baldwin (2005); Our result (Regression) Intensification of PJ J (+) AAO AO (+) K
Annular Modes pattern similar (J,K)- Baldwin and Dunkerton (2005) NAM at 1000 hPa and 10 hPa for Nov-Apr ,1958-2000
Regression : Solar signal in polar modes (J,K) SSN(JJA)1856-2004 SSN (Annually) 1856-1957 Both AO and AAO signal is seen during 1856-1957 AAO signal is seen in JJA even for whole 150 yr period (1856-2004) Using different TSI, the result is similar for solar cycle variability
Atmosphere only: Sun, polar vortex and lower stratosphere B: Kodera and Kuroda (2002) B (B.D.Circulation)
Solar influence: Polar vortex and lower stratosphere (B) Solar UV at 205 nm increases ~6% from solar min to solar max More ozone heating in upper stratosphere alters temperature and wind structure Solar heating anomalies also change the strength of polar stratospheric jet (U) This influences the path of upward propagating planetary waves which deposit their zonal momentum on the poleward side of the jet. (Fig: Kodera and Kuroda, 2002)
Stratosphere-Troposphere Coupling: Sun+QBO (A-M) QBO (Quasi-biannual Oscillation) L (-) L, M: our result (Regression) M (-)
Sun, QBO and Polar temperature in north pole Composites of time height development of NAM [Baldwin and Dunkerton, 2001] [Labitzke and van Loon, 1992] E ly/ Sol Min Warm W ly/ Sol Max Warm W ly/Sol Min Cold E ly/ Sol Max Cold W-ly QBO/ Solar min coldest E-ly QBO/ Solar max also cold Perturbation in polar stratosphere can affect troposphere for next few months
Sun, QBO and Atmosphere Regression of SLP with Solar*QBO(50 hPa): L,M -ve AO -ve AAO Active sun-westerly QBO and less active sun-easterly QBO both trigger negative AO and AAO features
Ocean Coupling (Pacific) Ocean Global ocean Conveyor belt: (+) Thermocline shifting Connect mid-latitude of Pacific to tropics Q O1 (-) (+) ENSO (inter-annual) Shallow MOC (+) N. Pacific warming P Walker circulation Cold Event of ENSO
Nio SST and Thermocline slope interconnected Volume transport convergence and SST averaged over eastern tropical Pacific
Atmosphere-Ocean (Pacific) Coupling: Sun+QBO+ENSO (A-S) Atmosphere Ocean Cloud free Midlatitude of Pacific N (+) Thermocline shifting (+) Trade wind (DJF) 1 1 C D Warming tropical lower stratosphere H C C D Q O1 Hadley cell (-) (B.D. Circulation) (-) (+) B Shallow MOC O2 Walker cell ENSO (inter-annual) (+) (+) Polar Vortex (B.D. Circulation) Solar (Decadal) A R E (-) Influence AL and PH (DJF) Ferrel cell N. Pacific warming G1 (+) P F G2 I Pole-ward shift & weakening of STJ S Intensification of PJ N, O2: Usual ENSO mechanism S: Carvalho et al., 2005 R: Camp and Tung (2007), Thompson and Baldwin (2001) L (+) J (-) AAO + (-) AO (+) M K QBO G2: Our result (Regression) (Quasi-biannual)
ENSO and JET : Carvalho et al., 2005 (S) Zonal wind (200 hPa) Negative AAO phase Positive AAO phase Negative-Positive Cold ENSO are linked with dominant positive AAO and vice versa AAO phases are allied with latitudinal migration of STJ and intensity of mid-latitude polar jet
Polar vortex and ENSO (R) : Thompson and Baldwin (2001) (Weak-strong vortex) Regression : Mid-latitude warming (G2)
Nature of ENSO was different before 1950s (and after 1997) Strong decrease in strength of shallow meridional overturning circulation (MOC) around tropical Pacific after 1950s Modest intensification since 1998 Also true for Walker and Hadley circulation; more in Walker. (McPhaden and Zhang,2004;Vecchi and Soden 2007) (1856-1957) & (1998-2007) (1958-1997) SunSpot Number SunSpot Number ENSO (DJF) ENSO (DJF) Could change in ocean and atmosphere circulation due to climate change during that period have modified the solar- ENSO behaviour?
Atmosphere-Ocean Coupling: Sun+QBO+ENSO+Climate change (A-Z) Atmosphere Ocean Cloud free Midlatitude of Pacific N (+) Thermocline shifting (-) (+) Trade wind (DJF) 1 1 C D X Climate Change (2nd half of 20th century) Warming tropical lower stratosphere H C D V2 W Q O1 T (-) Hadley cell (-) U V1 (-) (B.D. Circulation) (-) (-) (+) B Shallow MOC (+) (inter-annual) Walker cell O2 ENSO (+) (+) Polar Vortex Solar (Decadal) (B.D. Circulation) R A E Z (-) Y Influence AL and PH (DJF) Ferrel cell N. Pacific warming G1 (+) G2 P F I Pole-ward shift & weakening of STJ S Intensification of PJ U, T, W : (McPhaden and Zhang,2004; Vecchi, et al. 2007) V1, V2 : Usual ENSO mechanism V1 : Our result (Regression) X, Z : Our result (Regression) L (+) J (-) AAO + (-) AO (+) M K QBO (Quasi-biannual)
Solar Signal was different during 1958-1997 (X,Z,V1) 1958-1997 (DJF) 1856-1957(DJF) We are interested No solar signal is seen around ITCZ of eastern Pacific during later period Signal around AL weakened
Solar Signal on Tropical Pacific SST during 1958-1997(V1) Regression (SSN) for SST White et al. (1997) Warming in tropical E. Pacific after 1950s, follows White et al, (1997) But .. No signal when ENSO is included in regression. Also suggests White et al (1997) may not be true in earlier period.
Solar signal during 1958-1997 is also different in polar modes SSN (1958-1997) SSN (1856-1957) Pathways R and S may be potential route to influence polar modes. Using different Total Solar Irradiance (TSI), the result is similar.
Atmosphere-Ocean coupling (only Pacific) Next: In holistic representation include NAO and Indian summer monsoon Atlantic and Indian Ocean
Summary Discussed how sun is affecting troposphere. The effect is different in poles, if QBO is included. How ocean and atmosphere are connected. Active sun can influence SST in tropical Pacific though overwhelmed by strong influence of ENSO at LS period. Main Points: Proposed an overview how atmosphere and ocean might be affected by solar variability. How the effect is disturbed during last half of 20th century. Why true quantification of solar signal is so difficult.
Interested in Details Roy, I., 2013, The role of the sun in atmosphere-ocean coupling , International Journal of Climatology, doi:10.1002/joc.3713.


: Gray and Frame (2010)")

 and Pacific High (PH)")
")
")
- Baldwin and Dunkerton")
")

")
")


")

 Coupling: Sun+QBO+ENSO (A-S)")
")
 : Thompson and Baldwin (2001)")
")
")
")
")

")


")