Inflation and Monetary Policy in Macroeconomics


INFLATION &
MONETARY POLICY
ADVANCE MACROECONOMICS
AYESHA ANWAR

Outlines
Inflation
Types of Inflation
Causes of Inflation
Relationship of Inflation, Money growth and Interest Rate
Term Structure of Interest Rate
Back ward Looking Model
Forward Looking Model
Dynamic Inconsistency
Monetary Policy and Inflation
As Milton Friedman said “inflation is always and everywhere a monetary
phenomenon.”
Much of the study of inflation has focused on episodes of hyperinflation.
During hyperinflations, when prices are rising by hundreds or thousands of
percent per year.
Another aspect of inflation that has received a great deal of attention from
monetary and macroeconomists is the question of how to reduce it.
Does monetary policy have real effects?
There seem to be systematic positive correlations between money growth and
output growth in most industrial countries.
On the other hand, the real-business-cycle theorists explain that correlation
with the reverse causality. Rapid output growth leads to higher growth in the
demand for money.
Issues in Monetary Policy
There are many distinct issues involved in the study of monetary
policy.
Some are central issues such as studying how monetary policy
affects the economy
Others are relate to the policy process itself, the structure and
stability of financial markets, and the regulation and supervision of
the banking industry.
The macroeconomic questions relating to monetary policy tend to
fall into two major categories: long-run inflation control and short-run
stabilization policy.
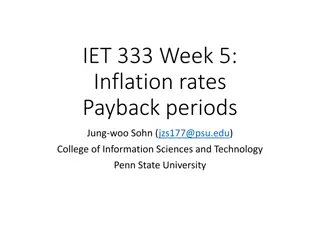
Inflation
Types
Creep
Walk
Run
Hyper inflation
Stagflation
Causes
Demand Pull
Cost Push
Excessive
money Supply
Wage-Price
Spiral
1.1 inflation, Money Growth and
Interest Rate
Long Run Scenario:
In the long run Money Supply comes up as the most
component affection price level. Not only money effects
price level But also money Growth causes most variation in
Aggregate Demand
(
Demand push inflation).
What happens to the other variables? (
i,
Y, MD)
The interest rate here in nominal interest rate and we are
usually interested in real
In long run output necessarily does not reduce
Usually income elasticity of demand is 1 and interest
Elasticity is (-0.2).
(see Goldfeld and Sichel 1990)
1.1.2 Money Growth and Interest
rates
The effects of an increase in money Growth
1.2 Monetary Policy and Term
Structure of Interest Rates
What is term Structure of Interest Rates?
The relationship among interest rates over different horizons in called
TERM STRUCTURE OF INTEREST RATES
and the standard theory that
explains this relationship is called
EXPECTATIONS THEORY OF THE TERM
STRUCTURE.
IN SHORT we will study the relationship of
long term and short term interest rates.
The Expectations Theory of the
Term Structure
1.3 Optimal Monetary Policy in a
Simple Backward-Looking Model
Monetary policy in a forward-
looking model
The simplest form of the monetary-policy rule suggests that by
“divine coincidence” monetary policy is able simultaneously to
minimize both terms of the central bank’s loss function: there is no
tradeoff between minimizing inflation and keeping output near the
natural level because the policy that does one also does the other.
Dynamic Inconsistency
MS ↑, interest rate ↓, Investment ↑, Consumption ↑, AD↑, Y↑
This process is called
Monetary Transmission Mechanism.
The process by which Monetary variables effect real variables
o
Channels 1) interest rate 2) credit 3) wealth 4) exchange rate.
o
It may be in the interest of the central bank in the short run to “fool”
the public by increasing the money supply more rapidly than
people expect. However, agents with rational expectations cannot
be fooled forever.
o
since inflation increases as monetary growth accelerates, the long-
run cost of such short-run stimulative policy actions is higher inflation
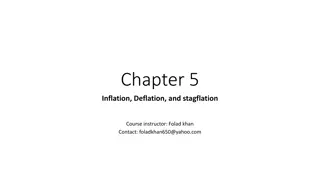
If the price of the shirt is likely to increase. What will happen?
Mankiw View
Maradona theory
Price
output
AS
AS
AS’
AD
AD’
P
P’
Kydland and Prescott also assume that inflation above some level is costly,
and that the marginal cost of inflation increases as inflation rises. A simple
way to capture these assumptions is to make social welfare quadratic in
both output and inflation. Thus the policymaker minimizes the loss Function.
The quadratic welfare function is as follows:
The policy objective function, which may or may not correspond to the true
social welfare function of the agents in the economy,it is like a utility function
for policymakers. This function expresses a cardinal preference measure for
the policymaker as a function of major economic variables. In the present
example, it is a function of output and inflation, though unemployment is
often used in place of output.
In the present case, it is more convenient to express the policymaker’s
preferences in terms of minimizing a loss function rather than maximizing an
objective function.
The only difference between a positive objective function and a loss function is
whether it is defined in a way that makes increases in the function good or bad.
In the objective function case, increases in the function are good and the
policymaker attempts to maximize the function; with the loss function, increases
in the function are bad and the policymaker’s goal is to minimize the function.
There are two crucial assumptions that are necessary to support that
main result of this model.
The first is that inflation is undesirable above some value π*.
The second is that the optimal level of output y* is greater than the
natural level
yn
to which the economy gravitates in long-run equilibrium
with correct expectations.
So the first order condition will be
Solving it for
π
:
If expected inflation were to remain constant, the policymaker would achieve
lower loss by following this short-run rule than with the π = π* rule
In the long run, however, agents will catch on to any higher inflation and adjust
their expectations. That means that any level of inflation that is higher (or lower)
than the expected rate will not be sustainable.
For any given level of inflationary expectations, one can calculate the
policymaker’s optimal short-run response. This is the “reaction function” that is
represented by the flatter upward-sloping curve in Figure
Seigniorage and Inflation
profit made by a government by issuing currency, especially the
difference between the face value of coins and their production
costs.
The issuance of new money is a very profitable enterprise. Newly
created money can be used to purchase goods and services, thus it
conveys “income” to its issuer. However, if the economy is at full
employment and money is neutral, then the issuance of new money
does not directly lead to the production of additional goods and
services.
Since the central bank usually issues new money by purchasing
government bonds or (which is the same thing) making loans
directly to the government, this “income” is typically transferred
from the central bank to the government and becomes the inflation
tax.
Who pays the inflation tax?
Seigniorage via inflation is a source of government revenue just like income
taxes, sales taxes, property taxes, import tariffs, etc.
Since the inflation tax is a tax on money balances (called the “tax base”), this is
nothing more than the familiar principle of taxation that an increase in a tax
rate will cause people to reduce the tax base.
If an increase in the tax rate (the inflation rate in this case) causes the tax base
(real money balances) to decline by enough, it is possible that the amount of
revenue would actually decline. This is represented by the inverse-U-shaped
inflation-tax Laffer curve:
Dynamics of inflation, types of inflation, causes, monetary policy implications, and issues in macroeconomics. Understand the relationship between inflation, money growth, interest rates, and economic stability.

Download Presentation

Please find below an Image/Link to download the presentation.
The content on the website is provided AS IS for your information and personal use only. It may not be sold, licensed, or shared on other websites without obtaining consent from the author.If you encounter any issues during the download, it is possible that the publisher has removed the file from their server.
You are allowed to download the files provided on this website for personal or commercial use, subject to the condition that they are used lawfully. All files are the property of their respective owners.
The content on the website is provided AS IS for your information and personal use only. It may not be sold, licensed, or shared on other websites without obtaining consent from the author.
E N D
Presentation Transcript
INFLATION & MONETARY POLICY ADVANCE MACROECONOMICS AYESHA ANWAR
Outlines Inflation Types of Inflation Causes of Inflation Relationship of Inflation, Money growth and Interest Rate Term Structure of Interest Rate Back ward Looking Model Forward Looking Model Dynamic Inconsistency
Monetary Policy and Inflation As Milton Friedman said inflation is always and everywhere a monetary phenomenon. Much of the study of inflation has focused on episodes of hyperinflation. During hyperinflations, when prices are rising by hundreds or thousands of percent per year. Another aspect of inflation that has received a great deal of attention from monetary and macroeconomists is the question of how to reduce it. Does monetary policy have real effects? There seem to be systematic positive correlations between money growth and output growth in most industrial countries. On the other hand, the real-business-cycle theorists explain that correlation with the reverse causality. Rapid output growth leads to higher growth in the demand for money.
Issues in Monetary Policy There are many distinct issues involved in the study of monetary policy. Some are central issues such as studying how monetary policy affects the economy Others are relate to the policy process itself, the structure and stability of financial markets, and the regulation and supervision of the banking industry. The macroeconomic questions relating to monetary policy tend to fall into two major categories: long-run inflation control and short-run stabilization policy.
Inflation Types Creep Walk Run Hyper inflation Stagflation Causes Demand Pull Cost Push Excessive money Supply Wage-Price Spiral
1.1 inflation, Money Growth and Interest Rate 1.1.1 Inflation and Money Growth: ? ?= ? ?,? ..(i) M = Money stock P = Price level i = Nominal interest rate Y = Real Income L= Demand for real Money balances
It can be re-written as: ? ? = . (ii) ? (?,?) So it defines Inflation OF GOODS AND SERVICES IN TERMS OF MONEY. Inflation as INCREASE IN AVERAGE PRICES SO eq (ii) states that Price level can increase due to 1) Increase in Money Supply 2) Increase in interest rate 3) Decrease in output 4) Decrease in Money Demand for given (i, Y)
Long Run Scenario: In the long run Money Supply comes up as the most component affection price level. Not only money effects price level But also money Growth causes most variation in Aggregate Demand (Demand push inflation). What happens to the other variables? (i, Y, MD) The interest rate here in nominal interest rate and we are usually interested in real In long run output necessarily does not reduce Usually income elasticity of demand is 1 and interest Elasticity is (-0.2). (see Goldfeld and Sichel 1990)
1.1.2 Money Growth and Interest rates There are interesting links between the growth of nominal money stock, and the behavior of inflation, real and Nominal interest rates and Real balances. ASSUMPTIONS: Prices are flexible it means long run is in discussion. Money Supply Does not effect Real out put and Real Interest rate. So it is assume that both of these are constant i.e ? ??? ?
By definition real interest rate in the between the Nominal interest rate and rate of inflation: i.e. ? = ? ??or can be written as: ? = ? + ?? .. ??? ??? ?? ???????? So by putting the value in Eq (ii) it will become as: ? ? = ? ( ? + ??, ? )
1.2 Monetary Policy and Term Structure of Interest Rates What is term Structure of Interest Rates? The relationship among interest rates over different horizons in called TERM STRUCTURE OF INTEREST RATES and the standard theory that explains this relationship is called EXPECTATIONS THEORY OF THE TERM STRUCTURE. IN SHORT we will study the relationship of long term and short term interest rates.
The Expectations Theory of the Term Structure Suppose that the interest rate on one-period loans beginning in period t (and repaid in t + 1) is ?? t is ??2 An individual who wants to lend money for two periods has a choice. He can buy a two-period bond and hold it to maturity or buy a one-period bond, hold it to maturity, then buy another one-period bond for the second period. for instance long bond is (1 + ??2)2 ?? for Short Bounds 1 + ?? As (1 + ??+1 ) is known , then the decision will be based on expected value ??( ??+1 ) rather than the Actual Value. 1and that the rate on two-period loans made in time 1 1(1 + ??+1 ) 1 1
So (1 + ??2)2must b equal to 1 + ?? By expanding polynomial product (1 + ??2)2 .. 1 + 2??2+ (??2)2 1 + 2??2+ (??2)2= 1 + ?? 1 1( 1 + ????+1 ) 1+ ????+1 or ??2= 1 + ?? 1 1 1????+1 ) 1+ ????+1 2(?? 1+ ????+1 1 1 2??2= ?? This last formula says that the interest rate on a long-term bond should equal the average of the expected interest rates on a sequence of short-term bonds covering the same time period. ??here is Term premium or Liquidity Premium It reflects the possibility of risk consideration that can make short term bonds less or more attractive as compared to Long term Bonds.
1.3 Optimal Monetary Policy in a Simple Backward-Looking Model let ???and ?? denote the economy s flexible-price and Walrasian levels of output, both in logs These equations define simple stochastic Model of the economy.
this is simple IS equation current equilibrium expenditures depend on last period s real interest rate, which is set by the central bank s monetary policy rule. The IS disturbance term ?? that do not result from central-bank changes, such as unusually high or low investment or consumption expenditures. Equation reflects the assumption that natural output is lower than optimal output by a non-negative amount . Optimal or Walrasian output is the output that would be produced in a perfect, Pareto-efficient world in which markets operated perfectly to map individual preferences into decisions about how much to work and produce. Natural output takes account of the imperfections in the model due to such factors as imperfect competition ??represents deviations from normal spending
Equation describes how these disturbance terms evolve over time. The coefficient ??measures the fraction of last period s disturbance that carries over into the current period. Equation is a standard, backward-looking Phillips curve or aggregate supply curve relating the current change in inflation to last period s output gap, the (positive or negative) difference between actual and natural output. Our analysis of the model consists of finding an optimal rule for setting monetary policy to minimize the central bank s loss function which is defined as: This loss function reflects the dual objectives of output stabilization and inflation control
Monetary policy in a forward- looking model The simplest form of the monetary-policy rule suggests that by divine coincidence monetary policy is able simultaneously to minimize both terms of the central bank s loss function: there is no tradeoff between minimizing inflation and keeping output near the natural level because the policy that does one also does the other.
Dynamic Inconsistency MS , interest rate , Investment , Consumption , AD , Y This process is called Monetary Transmission Mechanism. The process by which Monetary variables effect real variables o Channels 1) interest rate 2) credit 3) wealth 4) exchange rate. It may be in the interest of the central bank in the short run to fool the public by increasing the money supply more rapidly than people expect. However, agents with rational expectations cannot be fooled forever. o o since inflation increases as monetary growth accelerates, the long- run cost of such short-run stimulative policy actions is higher inflation
If the price of the shirt is likely to increase. What will happen? Mankiw View Maradona theory AS Price AS AS P AD P AD output
Kydland and Prescott also assume that inflation above some level is costly, and that the marginal cost of inflation increases as inflation rises. A simple way to capture these assumptions is to make social welfare quadratic in both output and inflation. Thus the policymaker minimizes the loss Function. The quadratic welfare function is as follows: The policy objective function, which may or may not correspond to the true social welfare function of the agents in the economy,it is like a utility function for policymakers. This function expresses a cardinal preference measure for the policymaker as a function of major economic variables. In the present example, it is a function of output and inflation, though unemployment is often used in place of output.
In the present case, it is more convenient to express the policymakers preferences in terms of minimizing a loss function rather than maximizing an objective function. The only difference between a positive objective function and a loss function is whether it is defined in a way that makes increases in the function good or bad. In the objective function case, increases in the function are good and the policymaker attempts to maximize the function; with the loss function, increases in the function are bad and the policymaker s goal is to minimize the function.
There are two crucial assumptions that are necessary to support that main result of this model. The first is that inflation is undesirable above some value *. The second is that the optimal level of output y* is greater than the natural level yn to which the economy gravitates in long-run equilibrium with correct expectations. So the first order condition will be Solving it for :
If expected inflation were to remain constant, the policymaker would achieve lower loss by following this short-run rule than with the = * rule In the long run, however, agents will catch on to any higher inflation and adjust their expectations. That means that any level of inflation that is higher (or lower) than the expected rate will not be sustainable. For any given level of inflationary expectations, one can calculate the policymaker s optimal short-run response. This is the reaction function that is represented by the flatter upward-sloping curve in Figure
Seigniorage and Inflation profit made by a government by issuing currency, especially the difference between the face value of coins and their production costs. The issuance of new money is a very profitable enterprise. Newly created money can be used to purchase goods and services, thus it conveys income to its issuer. However, if the economy is at full employment and money is neutral, then the issuance of new money does not directly lead to the production of additional goods and services. Since the central bank usually issues new money by purchasing government bonds or (which is the same thing) making loans directly to the government, this income is typically transferred from the central bank to the government and becomes the inflation tax.
Who pays the inflation tax? Seigniorage via inflation is a source of government revenue just like income taxes, sales taxes, property taxes, import tariffs, etc. Since the inflation tax is a tax on money balances (called the tax base ), this is nothing more than the familiar principle of taxation that an increase in a tax rate will cause people to reduce the tax base. If an increase in the tax rate (the inflation rate in this case) causes the tax base (real money balances) to decline by enough, it is possible that the amount of revenue would actually decline. This is represented by the inverse-U-shaped inflation-tax Laffer curve:


2must b equal to 1 + ??")