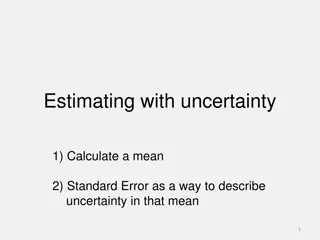
Importance of Estimating Measurement Uncertainty in Laboratories

ISO 19036 –
Measurement Uncertainty
Content
1.
Introduction
2.
Definitions
3.
ISO 19036 –  Components > ISO 19036 (2019) general approach
Combination between a global and a major component approach
4.
ISO 19036 –  Concepts not included in Measurement Uncertainty calculation
5.
ISO 19036 –  Practical approaches to estimate Measurement Uncertainty
6.
ISO 19036 –  Combined and Expanded Standard Uncertainty
7.
ISO 19036 –  Expression of Measurement Uncertainty in test reports
8.
ISO 19036 –  Summary
ISO 19036 –
Introduction
PURPOSE
The international standard ISO / IEC 17025 for testing and calibration
laboratories requires the laboratories to estimate the Measurement
Uncertainty(MU).
The laboratory’s customers use the results for taking important business
decisions globally.
Laboratories therefore select and determine the measurement methods to
ensure the overall variability by evaluating measurement uncertainty.
Too large or too small uncertainty may affect the reliability of the decision and
may make the situation complex and costly
So an appropriable estimate of measurement uncertainty is an important task
performed by laboratories
Why estimate measurement uncertainty? 
(1)
Significance of microbiological analysis of food
= direct hazard for the consumers’ health
Quantitative methods in food microbiology
 
= highly variable results (0,1-1 log
10
)
 
 n
eed to quantify this variability
Why estimate measurement uncertainty? 
(2)
Needed for accredited laboratories
What are the main requirements of ISO 17025 (2017)?
See clause 7.6:
To identify contributions to measurement uncertainty (MU)
To evaluate MU of test results
To take into account the main contributions to MU
If the test method precludes “rigorous” MU evaluation
 
MU estimation can be based on understanding of theoretical principles
or practical experience of method performance (= case for food microbiology)
Why estimate measurement uncertainty? 
(3)
Use of MU values to interpret analytical results
Different cases are shown below 
(adapted from EURACHEM / CITAC Guide CG 4)
:
In particular where the result, including MU, approaches (iii) or just exceeds
to (ii) the limit of a (legal) specification, such results are questionable
Why estimate measurement uncertainty? 
(4)
EURACHEM / CITAC Guide CG 4
<9.7.3>  Example
A decision rule that is currently widely used is that a result implies non compliance with
an upper limit if the measured value exceeds the limit by the expanded uncertainty. With
this decision rule, then only case (i) would imply non compliance. Similarly, for a
decision rule that a result implies compliance only if it is below the limit by the expanded
uncertainty, only case (iv) would imply compliance.
<9.7.4.> In general the decision rules may be more complicated than these.
Further discussion may be found in EURACHEM/CITAC Guide: The use of
uncertainty information in compliance assessment (2007)
Why estimate measurement uncertainty? 
(5)
S
e
e
 
C
l
a
u
s
e
 
7
.
8
.
6
 
I
S
O
 
1
7
0
2
5
 
R
e
p
o
r
t
i
n
g
 
s
t
a
t
e
m
e
n
t
s
 
o
f
c
o
n
f
o
r
m
i
t
y
“When a statement of conformity to a specification or standard is
provided, the laboratory shall document the decision rule employed, taking
into account the level of risk (such as false accept and false reject and
statistical assumptions
) associated with the decision rule employed, and
apply the decision rule.”
Why estimate measurement uncertainty? 
(6)
Conformity assessment is the process of assessing whether a
product complies with the requirement of a technical regulation or
product specification
Measurement results with uncertainty values are used for taking
compliance decision on products
The MU is a quality attribute of a measurement result and it is
therefore essential that the measurement result is fit for the
intended purpose
Correct estimation of MU ensure that risks associated with
compliance decision are within acceptable limits
Published by ISO in October 2019
Prepared by WG 2 « Statistics »
of  Sub-Committee 9 « Microbiology »
of ISO Technical Committee 34 « Food
products » (ISO/TC 34/SC 9)
Co-Project Leaders: Basil JARVIS,
Keith JEWEL, Paul IN’T VELD
Revision of ISO Technical Specification
19036 (
2006, amended in 2009)
Took into account feedback from the use
of the first version
Converted into a full ISO Standard
Partly harmonised with water microbiology
(ISO 29201)
ISO 19036 –
Definitions
Definitions
M
e
a
s
u
r
e
m
e
n
t
 
U
n
c
e
r
t
a
i
n
t
y
 
-
parameter, associated with the result of a measurement, that characterizes the
dispersion of the values that could reasonably be attributed to the measurand
S
t
a
n
d
a
r
d
 
U
n
c
e
r
t
a
i
n
t
y
 
-
uncertainty of the result of a measurement expressed as a standard deviation
C
o
m
b
i
n
e
d
 
S
t
a
n
d
a
r
d
 
U
n
c
e
r
t
a
i
n
t
y
 
-
standard uncertainty of the result of a measurement when that result is obtained
from the values of a number of other quantities, equal to the positive square
root of a sum of terms, the terms being the variances or covariances of these
other quantities weighed according to how the measurement result varies with
changes in these quantities
Definitions
E
x
p
a
n
d
e
d
 
U
n
c
e
r
t
a
i
n
t
y
 
-
quantity defining an interval about the result of a measurement that may be
expected to encompass a large fraction of the distribution of values that could
reasonably be attributed to the measurand
C
o
v
e
r
a
g
e
 
F
a
c
t
o
r
 
-
number larger than one by which a combined standard measurement
uncertainty is multiplied to obtain an expanded measurement uncertainty
ISO 19036 -
Measurement Uncertainty
Components
Uncertainty Components
T
e
c
h
n
i
c
a
l
 
u
n
c
e
r
t
a
i
n
t
y
 
 
u
n
c
e
r
t
a
i
n
t
y
 
r
e
s
u
l
t
i
n
g
 
f
r
o
m
 
o
p
e
r
a
t
i
o
n
a
l
v
a
r
i
a
b
i
l
i
t
y
 
a
s
s
o
c
i
a
t
e
d
 
w
i
t
h
 
t
h
e
 
t
e
c
h
n
i
c
a
l
 
s
t
e
p
s
 
o
f
 
t
h
e
 
a
n
a
l
y
t
i
c
a
l
p
r
o
c
e
d
u
r
e
s
M
a
t
r
i
x
 
u
n
c
e
r
t
a
i
n
t
y
 
-
 
u
n
c
e
r
t
a
i
n
t
y
 
r
e
s
u
l
t
i
n
g
 
f
r
o
m
 
t
h
e
 
e
x
t
e
n
t
 
t
o
 
w
h
i
c
h
t
h
e
 
t
e
s
t
 
p
o
r
t
i
o
n
 
i
s
 
n
o
t
 
t
r
u
l
y
 
r
e
p
r
e
s
e
n
t
a
t
i
v
e
 
o
f
 
t
h
e
 
l
a
b
o
r
a
t
o
r
y
 
s
a
m
p
l
e
(
n
o
t
 
o
f
 
t
h
e
 
b
a
t
c
h
 
s
a
m
p
l
e
d
)
D
i
s
t
r
i
b
u
t
i
o
n
a
l
 
u
n
c
e
r
t
a
i
n
t
y
 
-
 
u
n
c
e
r
t
a
i
n
t
y
 
r
e
s
u
l
t
i
n
g
 
f
r
o
m
 
i
n
t
r
i
n
s
i
c
v
a
r
i
a
b
i
l
i
t
y
 
a
s
s
o
c
i
a
t
e
d
 
w
i
t
h
 
t
h
e
 
d
i
s
t
r
i
b
u
t
i
o
n
 
o
f
 
m
i
c
r
o
o
r
g
a
n
i
s
m
 
i
n
 
t
h
e
t
e
s
t
 
p
o
r
t
i
o
n
,
 
t
h
e
 
i
n
i
t
i
a
l
 
s
u
s
p
e
n
s
i
o
n
 
a
n
d
 
s
u
b
s
e
q
u
e
n
t
 
d
i
l
u
t
i
o
n
s
Technical uncertainty; 
u
tech
associated with the main stages in microbiological method
considered as a performance characteristic when the method is
implemented in a given laboratory
estimated from reproducibility standard deviation on the final result
of the measurement process with options prioritized as follows:
1.
intralaboratory experiments
2.
interlaboratory studies
2.1 method validation studies
2.2 proficiency tests
usually, the largest of the three uncertainty components
Matrix uncertainty; 
u
matrix
arises from imperfect mixing of the laboratory sample
estimated for each matrix/food item
independent of analytical method used
can be large for solid matrices and multi-component food products
(e.g., pizza)
can be estimated based on three approaches
use of a fixed value; 
for well-mixed/homogeneous laboratory (or test) samples, the
matrix uncertainty is expected to be small and a fixed (minimum) value can be used
use of known value; 
relevant characteristics of the matrix well known and matrix
uncertainty estimated from prior knowledge
use of within-laboratory-sample repeatability standard deviation
Distributional uncertainty; 
u
distrib
arises from random distribution of microorganisms in the test
material
any estimate depends on the features of the analytical method
for colony-count techniques
Poisson uncertainty; 
u
Poisson
Confirmation uncertainty; 
u
conf
for MPN techniques
Most Probable Number uncertainty; 
u
MPN
estimated mathematically
ISO 19036 –
Concepts not included in
Measurement Uncertainty
calculation
Sampling uncertainty
Error associated with the drawing of the laboratory sample from a lot
under investigation
can contribute significantly to the overall error, but
is not considered as part of the uncertainty linked to the laboratory
test results
Bias
Estimate of a systematic measurement error
For quantitative methods in food chain microbiology, no “true” value
exists which is independent of the method used
assigned values or reference material values are not available for
routine test results
so cannot reliably estimate bias for a routine test result
ISO 19036 –
Practical approaches to estimate
Measurement Uncertainty
Practical approaches to estimate
Measurement Uncertainty-
Technical Uncertainty
is the characteristics of the method; 
technical uncertainty estimated for
one method cannot be applied to other methods
is estimated from the standard deviation of reproducibility on the
final result of the measurement process; 
preferably based on
“intralaboratory reproducibility”
is estimated by performing experiment – 
Data  may be collected in a short period of time as a special exercise or
over a period of time as part of labs routine quality assurance procedures.
In all cases ensure that the experiments design principle are followed (intralaboratory
reproducibility experiment, slides 28 and 29)
Identification of main sources of
Technical Uncertainty
Typical sources of uncertainty for colony-count or MPN techniques are:
stages of the test: e.g., weight of test portion; preparation of initial suspension,
serial dilutions, inoculation, incubation, colony counting (manual/automated),
confirmation
batches of culture media, reagents, test kits
Equipment: e.g., weighing equipment; vortex/mixers; volumetric
measuring/dispensing equipment; pipettes; incubators/baths
tolerances within method: e.g., temperature range; incubation times
 technicians/operators
Technical Uncertainty- 
Measurements conditions
the measurement conditions (e.g., A and B) for each test portions
should differ in as many ways as possible
the measurement conditions should include as many variations in
all relevant sources of technical uncertainty as could be
encountered from one day to another within the laboratory
the pattern of variation should not be the same for all laboratory
(test) samples
Technical Uncertainty-
Intralaboratory reproducibility experiment
For each test method, perform
the experimental protocol for:
at least 10 laboratory
samples
at least 2 acceptable
measurements/results for
each laboratory sample
repeat design for each
laboratory sample
Technical Uncertainty- 
Intralaboratory reproducibility experiment
homogenise the laboratory sample to minimise matrix uncertainty
the laboratory sample, where possible, should cover the expected
natural variation in contamination levels
if artificial contamination is needed, 
spike initial suspension
vary parameters/measurement conditions
to reflect day to day variations within your lab and parameters
within your method
Intralaboratory reproducibility –
External PT Samples
Laboratory’s results from analysis of PT samples can be used to
contribute to intralaboratory reproducibility estimate of uncertainty
but only if:
a)
PT samples representative of routine samples analysed by the laboratory
(matrix type, test portion size) AND
b)
Laboratory carries out estimates on 2 or more test portions from the PT
sample supplied, under different measurement conditions
Caution: If intralaboratory reproducibility estimates from PT samples differ markedly from in-house estimates  on “real”
samples of a similar type, the differences shall be recognized and recorded as may reflect differences in matrix and
microbial inoculum in the PT sample
.
Intralaboratory reproducibility –
Non acceptable results
Criteria for excluding results from the calculation of intralaboratory reproducibility
(NOT for routine test results)
Colony-count techniques:
results based on <30 counted colonies and counts > max countable number of colonies
CCT techniques including partial confirmation:
results for which less than half of the colonies tested were confirmed
MPN techniques:
results used to be based on not less than 5 positive results across all dilutions tested for a single
test result.
Technical Uncertainty – 
Intralaboratory reproducibility standard deviation
Technical Uncertainty – 
Intralaboratory reproducibility standard deviation
more than two values from each laboratory sample : calculate standard
deviation by one-way ANOVA (square root of within-groups mean square
value)
Technical standard uncertainty: 
u
tech
 = 
s
IR
Alternative options to estimate
Technical Uncertainty
Reproducibility standard deviation derived from results of method
validation interlaboratory study
recommended by ISO 19036 only as a 2
nd
 option to intralaboratory reproducibility
Reproducibility derived from results of an interlaboratory proficiency
test (estimate of reproducibility derived from the test results of
participants using the same method in the same round/distribution)
recommended by ISO 19036 only as 3
rd
 option to intralaboratory reproducibility
For more details refer to ISO 21748 “
Guidance for the use of repeatability,
reproducibility and trueness estimates in measurement uncertainty evaluation”
Reproducibility standard deviation derived
from results of method validation
interlaboratory studies
Condition
Laboratory may use the reproducibility standard deviation of an
interlaboratory validation study as an estimate of its technical
MU, if:
The repeatability and reproducibility estimates of precision obtained
by measurements within the laboratory is not larger than the
corresponding values obtained in the interlaboratory study.
Reproducibility standard deviation derived
from results of method validation
interlaboratory studies
Limitations
reproducibility parameters from interlaboratory studies not available for all
methods
the extent to which taking test portion/preparing initial suspension
includes matrix effects depends on experimental design of the
interlaboratory study
may underestimate uncertainty
adequate detail is unlikely to be available to correct for unwanted
uncertainty components.
R
e
p
r
o
d
u
c
i
b
i
l
i
t
y
 
s
t
a
n
d
a
r
d
 
d
e
v
i
a
t
i
o
n
 
d
e
r
i
v
e
d
 
f
r
o
m
r
e
s
u
l
t
s
 
o
f
 
a
n
 
i
n
t
e
r
l
a
b
o
r
a
t
o
r
y
 
p
r
o
f
i
c
i
e
n
c
y
 
t
e
s
t
When same method is used by all participants in a PT, a laboratory
whose result assessed as satisfactory by the PT provider may
estimate its technical uncertainty as the standard deviation of all
results assessed as satisfactory by the PT provider.
Limitations
:
the extent to which taking test portion/preparing initial suspension includes
matrix effects depends on the PT experimental design
may overestimate technical uncertainty
Technical Uncertainty – 
Reproducibility standard deviation
Note:
Reproducibility standard deviation will include any of the matrix and
distributional components relevant to the reproducibility data, thus
the combined uncertainty measurement of the test result will be an
overestimate of uncertainty.
As an option, lab can avoid this by subtracting any of the relevant
matrix and distributional components from the experimental
reproducibility.
Practical approaches to estimate
Measurement Uncertainty-
Matrix Uncertainty
Matrix Uncertainty
reflects the extent to which test portion is not truly representative of
the laboratory sample
refers only to the effects of microbial distribution in a given matrix
considered as 
independent of the analytical method used
applies to all measurands on the same 
matrix/food item
can be estimated if/when required (e.g., by customer)
Matrix Uncertainty
Approaches to estimate matrix uncertainty:
A.
Use of fixed value
 - for 
homogenous or well-mixed laboratory
sample, a minimum fixed value can be used 
B.
Repeatability experiments
 - analysing multiple test portions from
laboratory samples to determine the within-sample variance
C.
Already known 
- relevant characteristics of the matrix well known
and matrix uncertainty estimated from prior knowledge
Matrix Uncertainty
A.
H
o
m
o
g
e
n
e
o
u
s
 
m
a
t
r
i
x
 
o
r
 
h
o
m
o
g
e
n
i
s
e
d
 
l
a
b
o
r
a
t
o
r
y
s
a
m
p
l
e
Experience indicates that liquids are regarded as being
homogeneous and thus have a relatively low matrix
uncertainty, typically 
u
matrix
 = 0,1 log
10 
cfu/g or ml
derived from 2003/2004 experiments reported in Ah Soon C. and
Cornu M.
Provided that the whole of the laboratory sample can be
homogenised before taking the test portion, then the matrix
uncertainty can be taken at a fixed value of 
u
matrix
 = 0,1 log
10
.
For more details on homogenisation refer to ISO 6887 series.
Matrix Uncertainty
B
.
 
E
x
p
e
r
i
m
e
n
t
 
-
 
M
u
l
t
i
p
l
e
 
t
e
s
t
 
p
o
r
t
i
o
n
s
 
f
r
o
m
 
l
a
b
o
r
a
t
o
r
y
s
a
m
p
l
e
s
Matrix uncertainty may be estimated as the within-laboratory-sample
repeatability standard deviation
 
by analysing multiple test portions in repeatability conditions 
from
one or more laboratory samples.
Repeated measurements on a single laboratory sample are made
under same conditions 
(
i.e., same time, same operator, same equipment,
same media batches, same equipment etc).
Repeated measurements from multiple laboratory samples, may be
analysed over a period of time to give a more generally applicable
estimate of matrix uncertainty.
Matrix Uncertainty –
Repeatability Experiment
Repeat design for each laboratory sample
do not homogenise
do not artificially contaminate
Matrix uncertainty is regarded as
independent of target microorganism
and test method used
chose target microorganisms for which naturally
contaminated samples are likely to be found (e.g. TVC)
Matrix Uncertainty –
Repeatability Experiment
take at least two test portions from each laboratory sample
total number of test portions = at least 10 or more than the number of
laboratory samples, i.e.
1 laboratory sample
at least 11 results (all in same batch)
10 or more laboratory samples (from same matrix)
at least 2 results each (replicates in same batch)
Matrix Uncertainty –
Repeatability standard deviation
transform cfu/g or cfu/ml results into log
10
 values
calculate repeatability standard deviation 
s
r 
:
Single laboratory sample: calculate standard deviation
Multiple laboratory samples: calculate standard deviation by one-way
ANOVA (square root of within-groups mean square value)
matrix standard uncertainty: 
u
matrix
 = 
s
r
 
Matrix Uncertainty
C
.
 
A
l
r
e
a
d
y
 
k
n
o
w
n
The laboratory may be able to judge, from prior knowledge, the matrix
uncertainty to be expected of a given laboratory sample. This may rely
on previous analyses of multiple test portions from laboratory samples
expected to have a similar matrix uncertainty (matrix homogeneity).
When assessing whether laboratory samples can be expected to have
a similar matrix uncertainty, the laboratory may consider examples of
items for different categories and types provided in ISO 16140-3.
Matrix uncertainty values obtained in one laboratory may be used by
another laboratory for laboratory samples expected to have a similar
matrix uncertainty.
Matrix Uncertainty –
Repeatability standard deviation
Note:
Repeatability standard deviation will include any of the technical and
distributional components relevant to the repeatability data, thus the
combined uncertainty measurement of the test result will be an
overestimate of uncertainty.
As an option, lab can avoid this by subtracting any of the relevant
distributional components from the experimental repeatability, if these
are available.
Practical approaches to estimate
Measurement Uncertainty-
Distributional Uncertainty
irreducible minimum uncertainty components
 
(assuming 
homogeneous material/perfect 
mixing)
specific to individual measurement result
depending on analytical method, there are three types
Poisson 
uncertainty
confirmation uncertainty
Most Probable Number uncertainty
the associated standard uncertainties can be calculated from look
up tables (no practical work);
ISO 19036 provides details on relevant look up tables
Colony-count technique –
Poisson uncertainty, 
u
Poisson
Colony-count technique –
Confirmation uncertainty, 
u
Conf
MPN technique –
Most Probable Number uncertainty, 
u
MPN
The Most Probable Number technique derives most probable
numbers from multiple detection or non-detection results.
The minimum distributional uncertainty for MPN technique is
greater than simple Poisson distributional uncertainty.
Statistical procedure used to determine the uncertainty of MPN
technique is detailed in Annex C of ISO 19036.
ISO 19036 –
Combined and Expanded
Standard Uncertainty
Combined standard uncertainty
Option 1: A combination of separately estimated:
technical standard uncertainty
matrix standard uncertainty
distributional standard uncertainties
O
r
Option 2: reproducibility standard deviation alone (technical
standard uncertainty)
Option 1: Combined standard uncertainty based on
separate technical, matrix and distributional standard
uncertainties
estimate technical uncertainty as a reproducibility standard deviation
optionally corrected for matrix and distributional uncertainties
     u
tech
 = s
R
 or u
tech
 = s
R:corr
estimate matrix uncertainty
when estimated from within-laboratory-sample repeatability standard
deviation, may be optionally corrected for distributional uncertainties
u
matrix
 = s
r
 or u
matrix
 = s
r:corr
Option 1: Combined standard uncertainty based on
separate technical, matrix and distributional standard
uncertainties
Option 2: Combined uncertainty based on
reproducibility standard deviation alone
Expanded uncertainty
ISO 19036 –
Expression of Measurement
Uncertainty in test reports
Reporting Measurement Uncertainty
MU reported in same units as test result
number of figures in reported MU to reflect practical measurement
capability
recommended expanded uncertainty be rounded to 2 significant figures 
measurement result (i.e., test result) reported to same decimal
places as MU
Reporting Measurement Uncertainty
Three options to express MU in test report:
using log
10
 scale
Option 1: log
10
 result ± 
U
  :  
y
 ± 
U
 log
10
 cfu/g
Option 2: log
10
 result with limits : 
y
 log
10
 cfu/g [y - 
U
; y + 
U
]
using natural values 
(anti-log
)
Option 3: natural result value with limits : 
x
 cfu/g  [10
y
U
; 10
y
 + 
U
]
R
e
s
u
l
t
 
(
x
)
 
=
 
1
,
0
0
 
x
1
0
5
 
c
f
u
/
g
,
 
t
h
e
r
e
f
o
r
e
 
y
 
=
 
l
o
g
1
0
 
r
e
s
u
l
t
 
(
x
)
 
 
=
 
5
,
0
0
a
n
d
 
c
o
n
s
i
d
e
r
i
n
g
 
 
U
 
=
 
0
,
3
1
 
l
o
g
1
0
Report using log
10
 scale
log
10
 result ± 
U
  :  
y ± U 
log
10
 cfu/g
    
  
5,00 +/- 0,31 log
10
 cfu/g
log
10
 result with limits : 
y
 log
10
 cfu/g [
y – U 
; 
y + U
]
  
y – U  
= 5,00 – 0,31 = 4,69
  
y + U 
= 5,00 + 0,31 = 5,31
    
  
5,00 log
10
 cfu/g [4,69; 5,31]
Example
Example
Report using natural values (anti-log)
natural result value with limits : 
x
 cfu/g  [10
y
U
 
; 10
y
 + 
U
]
  
10
y-U
 
= 10
4,69
 = 48977 (rounded to 4,90 x 10
4
)
  
10
y+U
 = 10
5,31
 = 204173 (rounded to 2,04 x 10
5
)
    
  
1,00 x10
5
 cfu/g [4,90 x 10
4
 ; 2,04 x 10
5
] 
Results below Limit of Quantification
Can arise:
for a colony-count method, when the number of counted colonies
is zero, ΣC = 0
for a colony-count method with partial confirmation, when the
number of confirmed colonies is zero, 
n
c
 = 0
for a MPN method, when there are no detection results, 
x
i
 = 0 for
all dilutions 
i
Example - CCT
Example - CCT
Example - CCT
y
L
O
Q
 
:
 
l
o
g
1
0
 
L
O
Q
 
(
x
L
O
Q
)
 
=
 
0
,
9
5
9
 
l
o
g
1
0
 
c
f
u
/
g
 
(
r
o
u
n
d
e
d
 
t
o
 
0
,
9
6
)
Report using log
10
 scale
log
10
 result ± 
U
  :  < 
y
LOQ
 ± 
U
 log
10
 cfu/g
<
0
,
9
6
 
+
/
-
 
0
,
9
4
 
l
o
g
1
0
 
c
f
u
/
g
log
10
 result with limits : <
y
LOQ
 log
10
 cfu/g [< 
y
LOQ
 - 
U
; 
y
LOQ 
+ 
U
]
y
L
O
Q


U
 
=
 
0
,
9
5
9
 
-
 
 
0
,
9
4
0
 
=
 
0
,
0
1
9
 
l
o
g
1
0
c
f
u
/
g
 
(
r
o
u
n
d
e
d
 
t
o
 
0
,
0
2
)
y
L
O
Q
 
+
 
U
 
=
 
0
,
9
5
9
 
+
 
0
,
9
4
0
 
=
 
1
,
8
9
9
 
l
o
g
1
0
c
f
u
/
g
 
(
r
o
u
n
d
e
d
 
t
o
 
1
,
9
0
)
<
0
,
9
6
 
l
o
g
1
0
 
c
f
u
/
g
 
[
<
0
,
0
2
;
 
1
,
9
0
]
Example - CCT
Report using natural values (anti-log)
natural result value with limits : <
x
LOQ
 cfu/g  [0; 10
y
LOQ
+ 
U
]
  
y
LOQ
+ 
U
 = 0,959 + 0,940 = 1,899
1
0
y
L
O
Q
+
U
 
=
 
1
0
1
,
8
9
9
 
=
 
7
9
,
1
6
 
c
f
u
 
(
r
o
u
n
d
e
d
 
t
o
 
7
9
,
2
)
<
 
9
,
1
 
c
f
u
/
g
 
[
0
,
0
;
 
7
9
,
2
]
NOTE:
y
LOQ
-
U
 can be negative, but 10
y
LOQ
-
U
 is always positive
Reporting Measurement Uncertainty
Include in the test report an explicit statement that
the indicated MU is an expanded uncertainty
statement of the confidence level
indication that the MU has been estimated in accordance with
ISO 19036
“The reported expanded measurement uncertainty has been
estimated in accordance with ISO 19036 and is based on a standard
uncertainty multiplied by a coverage factor of 
k
 = 2, providing a level
of confidence of approximately 95 %.”
Reporting Measurement Uncertainty
If the MU is based on reproducibility standard deviation alone, this
shall be made clear in the test report:
“The reported expanded measurement uncertainty has been
estimated in accordance with ISO 19036 and is based on a standard
uncertainty multiplied by a coverage factor of 
k
 = 2, providing a level
of confidence of approximately 95 %. Combined standard
uncertainty has been taken as equal to the intralaboratory
reproducibility standard deviation.”
ISO 19036 –
Summary
Calculations
Excel tool implementing the calculations of ISO 19036 (2019)
Developed by Campden BRI (UK)
Verified by WG 2 of ISO/TC 34/SC 9
Freely available on line at
https://committee.iso.org/sites/tc34sc9/home/general-standards/content-left-area/culture-media/iso-19036-
estimation-of-measurem.html
Refer to the 1
st
 worksheet “Read me” for the instructions
Excel calculations tool
2
nd
 worksheet “Reproducibility”
Calculates the intralaboratory reproducibility standard deviation (
s
IR
)
= 1
st
 option to estimate the technical uncertainty
Enter in column A laboratory sample identifiers and in column B the
results of the experimental study on technical uncertainty
(5.2.2 in ISO 19036)
3
rd
 worksheet “Repeatability”
Calculates the repeatability standard deviation
= to estimate the matrix uncertainty
Enter in column A laboratory sample identifiers and in column B the
results of the experimental study on matrix uncertainty (6.3)
Calculations Excel tool
4
th
 worksheet “Combined”
Calculates the expanded uncertainty (MU)
To associate MU to results obtained by the laboratory, enter in column A
laboratory sample identifiers and in column B the results of samples
analysed by the laboratory
Enter in column E technical uncertainty: 
s
IR
 from worksheet “Reproducibility”
or interlaboratory standard deviation from method validation (5.2.3.1)
or from PT (5.2.3.2)
Optional: enter in column F matrix uncertainty from worksheet
“Repeatability”
Optional: enter in columns G-Q data for distributional uncertainties,
depending on the technique: CCT with/without partial confirmation, MPN
Conclusion
Values of matrix uncertainty per matrix type/item to be provided at
a later stage
Revised version of ISO 19036 offers a pragmatic approach to MU
in quantitative food chain microbiology
 
choice left between
Comprehensive approach with 3 components: technical, matrix and
distributional uncertainties
Simplified approach: MU restricted to technical uncertainty
ISO 19036 to be used, in particular, for accreditation purposes,
and also for regulatory purposes where MU is to be taken into
account for result interpretation/decision limit
Towards a generalised MU estimation in the community of food
microbiological laboratories worldwide
Slide Note
Embed
Share

International standard ISO/IEC 17025 necessitates laboratories to determine Measurement Uncertainty (MU) to ensure reliable decision-making globally. Estimating MU is crucial as it impacts the variability of results, influencing the credibility and cost-effectiveness of decisions. Accurate estimation of MU is a significant task carried out by laboratories, with various practical approaches and considerations outlined in ISO 19036.

  • Measurement Uncertainty
  • Laboratories
  • ISO Standards
  • Decision-making
  • Variability

Uploaded on Sep 18, 2024 | 0 Views


Download Presentation

Please find below an Image/Link to download the presentation.

The content on the website is provided AS IS for your information and personal use only. It may not be sold, licensed, or shared on other websites without obtaining consent from the author. Download presentation by click this link. If you encounter any issues during the download, it is possible that the publisher has removed the file from their server.

E N D

Presentation Transcript


  1. ISO 19036 Measurement Uncertainty

  2. Content 1. Introduction 2. Definitions 3. ISO 19036 Components > ISO 19036 (2019) general approach Combination between a global and a major component approach 4. ISO 19036 Concepts not included in Measurement Uncertainty calculation 5. ISO 19036 Practical approaches to estimate Measurement Uncertainty 6. ISO 19036 Combined and Expanded Standard Uncertainty 7. ISO 19036 Expression of Measurement Uncertainty in test reports 8. ISO 19036 Summary

  3. ISO 19036 Introduction

  4. PURPOSE The international standard ISO / IEC 17025 for testing and calibration laboratories requires the laboratories to estimate the Measurement Uncertainty(MU). The laboratory s customers use the results for taking important business decisions globally. Laboratories therefore select and determine the measurement methods to ensure the overall variability by evaluating measurement uncertainty. Too large or too small uncertainty may affect the reliability of the decision and may make the situation complex and costly So an appropriable estimate of measurement uncertainty is an important task performed by laboratories

  5. Why estimate measurement uncertainty? (1) Significance of microbiological analysis of food = direct hazard for the consumers health Quantitative methods in food microbiology = highly variable results (0,1-1 log10) need to quantify this variability

  6. Why estimate measurement uncertainty? (2) Needed for accredited laboratories What are the main requirements of ISO 17025 (2017)? See clause 7.6: To identify contributions to measurement uncertainty (MU) To evaluate MU of test results To take into account the main contributions to MU If the test method precludes rigorous MU evaluation MU estimation can be based on understanding of theoretical principles or practical experience of method performance (= case for food microbiology)

  7. Why estimate measurement uncertainty? (3) Use of MU values to interpret analytical results Different cases are shown below (adapted from EURACHEM / CITAC Guide CG 4): In particular where the result, including MU, approaches (iii) or just exceeds to (ii) the limit of a (legal) specification, such results are questionable

  8. Why estimate measurement uncertainty? (4) EURACHEM / CITAC Guide CG 4 <9.7.3> Example A decision rule that is currently widely used is that a result implies non compliance with an upper limit if the measured value exceeds the limit by the expanded uncertainty. With this decision rule, then only case (i) would imply non compliance. Similarly, for a decision rule that a result implies compliance only if it is below the limit by the expanded uncertainty, only case (iv) would imply compliance. <9.7.4.> In general the decision rules may be more complicated than these. Further discussion may be found in EURACHEM/CITAC Guide: The use of uncertainty information in compliance assessment (2007)

  9. Why estimate measurement uncertainty? (5) See Clause 7.8.6 ISO 17025 Reporting statements of conformity When a statement of conformity to a specification or standard is provided, the laboratory shall document the decision rule employed, taking into account the level of risk (such as false accept and false reject and statistical assumptions) associated with the decision rule employed, and apply the decision rule.

  10. Why estimate measurement uncertainty? (6) Conformity assessment is the process of assessing whether a product complies with the requirement of a technical regulation or product specification Measurement results with uncertainty values are used for taking compliance decision on products The MU is a quality attribute of a measurement result and it is therefore essential that the measurement result is fit for the intended purpose Correct estimation of MU ensure that risks associated with compliance decision are within acceptable limits

  11. Published by ISO in October 2019 Prepared by WG 2 Statistics of Sub-Committee 9 Microbiology of ISO Technical Committee 34 Food products (ISO/TC 34/SC 9) Co-Project Leaders: Basil JARVIS, Keith JEWEL, Paul IN T VELD Revision of ISO Technical Specification 19036 (2006, amended in 2009) Took into account feedback from the use of the first version Converted into a full ISO Standard Partly harmonised with water microbiology (ISO 29201)

  12. ISO 19036 Definitions

  13. Definitions Measurement Uncertainty - parameter, associated with the result of a measurement, that characterizes the dispersion of the values that could reasonably be attributed to the measurand Standard Uncertainty - uncertainty of the result of a measurement expressed as a standard deviation Combined Standard Uncertainty - standard uncertainty of the result of a measurement when that result is obtained from the values of a number of other quantities, equal to the positive square root of a sum of terms, the terms being the variances or covariances of these other quantities weighed according to how the measurement result varies with changes in these quantities

  14. Definitions Expanded Uncertainty - quantity defining an interval about the result of a measurement that may be expected to encompass a large fraction of the distribution of values that could reasonably be attributed to the measurand Coverage Factor - number larger than one by which a combined standard measurement uncertainty is multiplied to obtain an expanded measurement uncertainty

  15. ISO 19036 - Measurement Uncertainty Components

  16. Uncertainty Components Technical uncertainty uncertainty resulting from operational variability associated with the technical steps of the analytical procedures Matrix uncertainty - uncertainty resulting from the extent to which the test portion is not truly representative of the laboratory sample (not of the batch sampled) Distributional uncertainty - uncertainty resulting from intrinsic variability associated with the distribution of microorganism in the test portion, the initial suspension and subsequent dilutions

  17. Technical uncertainty; utech associated with the main stages in microbiological method considered as a performance characteristic when the method is implemented in a given laboratory estimated from reproducibility standard deviation on the final result of the measurement process with options prioritized as follows: 1. intralaboratory experiments 2. interlaboratory studies 2.1 method validation studies 2.2 proficiency tests usually, the largest of the three uncertainty components

  18. Matrix uncertainty; umatrix arises from imperfect mixing of the laboratory sample estimated for each matrix/food item independent of analytical method used can be large for solid matrices and multi-component food products (e.g., pizza) can be estimated based on three approaches use of a fixed value; for well-mixed/homogeneous laboratory (or test) samples, the matrix uncertainty is expected to be small and a fixed (minimum) value can be used use of known value; relevant characteristics of the matrix well known and matrix uncertainty estimated from prior knowledge use of within-laboratory-sample repeatability standard deviation

  19. Distributional uncertainty; udistrib arises from random distribution of microorganisms in the test material any estimate depends on the features of the analytical method for colony-count techniques Poisson uncertainty; uPoisson Confirmation uncertainty; uconf for MPN techniques Most Probable Number uncertainty; uMPN estimated mathematically

  20. ISO 19036 Concepts not included in Measurement Uncertainty calculation

  21. Sampling uncertainty Error associated with the drawing of the laboratory sample from a lot under investigation can contribute significantly to the overall error, but is not considered as part of the uncertainty linked to the laboratory test results

  22. Bias Estimate of a systematic measurement error For quantitative methods in food chain microbiology, no true value exists which is independent of the method used assigned values or reference material values are not available for routine test results so cannot reliably estimate bias for a routine test result

  23. ISO 19036 Practical approaches to estimate Measurement Uncertainty

  24. Practical approaches to estimate Measurement Uncertainty- Technical Uncertainty

  25. Technical Uncertainty is the characteristics of the method; technical uncertainty estimated for one method cannot be applied to other methods is estimated from the standard deviation of reproducibility on the final result of the measurement process; preferably based on intralaboratory reproducibility is estimated by performing experiment Data may be collected in a short period of time as a special exercise or over a period of time as part of labs routine quality assurance procedures. In all cases ensure that the experiments design principle are followed (intralaboratory reproducibility experiment, slides 28 and 29)

  26. Identification of main sources of Technical Uncertainty Typical sources of uncertainty for colony-count or MPN techniques are: stages of the test: e.g., weight of test portion; preparation of initial suspension, serial dilutions, inoculation, incubation, colony counting (manual/automated), confirmation batches of culture media, reagents, test kits Equipment: e.g., weighing equipment; vortex/mixers; volumetric measuring/dispensing equipment; pipettes; incubators/baths tolerances within method: e.g., temperature range; incubation times technicians/operators

  27. Technical Uncertainty- Measurements conditions the measurement conditions (e.g., A and B) for each test portions should differ in as many ways as possible the measurement conditions should include as many variations in all relevant sources of technical uncertainty as could be encountered from one day to another within the laboratory the pattern of variation should not be the same for all laboratory (test) samples

  28. Technical Uncertainty- Intralaboratory reproducibility experiment For each test method, perform the experimental protocol for: at least 10 laboratory samples at least 2 acceptable measurements/results for each laboratory sample repeat design for each laboratory sample

  29. Technical Uncertainty- Intralaboratory reproducibility experiment homogenise the laboratory sample to minimise matrix uncertainty the laboratory sample, where possible, should cover the expected natural variation in contamination levels if artificial contamination is needed, spike initial suspension vary parameters/measurement conditions to reflect day to day variations within your lab and parameters within your method

  30. Intralaboratory reproducibility External PT Samples Laboratory s results from analysis of PT samples can be used to contribute to intralaboratory reproducibility estimate of uncertainty but only if: a) PT samples representative of routine samples analysed by the laboratory (matrix type, test portion size) AND b) Laboratory carries out estimates on 2 or more test portions from the PT sample supplied, under different measurement conditions Caution: If intralaboratory reproducibility estimates from PT samples differ markedly from in-house estimates on real samples of a similar type, the differences shall be recognized and recorded as may reflect differences in matrix and microbial inoculum in the PT sample.

  31. Intralaboratory reproducibility Non acceptable results Criteria for excluding results from the calculation of intralaboratory reproducibility (NOT for routine test results) Colony-count techniques: results based on <30 counted colonies and counts > max countable number of colonies CCT techniques including partial confirmation: results for which less than half of the colonies tested were confirmed MPN techniques: results used to be based on not less than 5 positive results across all dilutions tested for a single test result.

  32. Technical Uncertainty Intralaboratory reproducibility standard deviation transform cfu/g or cfu/ml results into log10 values calculate intralaboratory reproducibility standard deviation sIR : two values from each laboratory sample : ? 1 (??? ???)2 ???= 2? ?=1 where: i is the index number of the sample, i = 1 ton (n 10) yiA, yiBare the log-transformed data, in log10 cfu/gr or ml, from condition A and B respectively

  33. Technical Uncertainty Intralaboratory reproducibility standard deviation more than two values from each laboratory sample : calculate standard deviation by one-way ANOVA (square root of within-groups mean square value) Technical standard uncertainty: utech = sIR

  34. Alternative options to estimate Technical Uncertainty Reproducibility standard deviation derived from results of method validation interlaboratory study recommended by ISO 19036 only as a 2nd option to intralaboratory reproducibility Reproducibility derived from results of an interlaboratory proficiency test (estimate of reproducibility derived from the test results of participants using the same method in the same round/distribution) recommended by ISO 19036 only as 3rd option to intralaboratory reproducibility For more details refer to ISO 21748 Guidance for the use of repeatability, reproducibility and trueness estimates in measurement uncertainty evaluation

  35. Reproducibility standard deviation derived from results of method validation interlaboratory studies Condition Laboratory may use the reproducibility standard deviation of an interlaboratory validation study as an estimate of its technical MU, if: The repeatability and reproducibility estimates of precision obtained by measurements within the laboratory is not larger than the corresponding values obtained in the interlaboratory study.

  36. Reproducibility standard deviation derived from results of method validation interlaboratory studies Limitations reproducibility parameters from interlaboratory studies not available for all methods the extent to which taking test portion/preparing initial suspension includes matrix effects depends on experimental design of the interlaboratory study may underestimate uncertainty adequate detail is unlikely to be available to correct for unwanted uncertainty components.

  37. Reproducibilitystandard deviation derived from results of an interlaboratory proficiency test When same method is used by all participants in a PT, a laboratory whose result assessed as satisfactory by the PT provider may estimate its technical uncertainty as the standard deviation of all results assessed as satisfactory by the PT provider. Limitations: the extent to which taking test portion/preparing initial suspension includes matrix effects depends on the PT experimental design may overestimate technical uncertainty

  38. Technical Uncertainty Reproducibility standard deviation Note: Reproducibility standard deviation will include any of the matrix and distributional components relevant to the reproducibility data, thus the combined uncertainty measurement of the test result will be an overestimate of uncertainty. As an option, lab can avoid this by subtracting any of the relevant matrix and distributional components from the experimental reproducibility.

  39. Practical approaches to estimate Measurement Uncertainty- Matrix Uncertainty

  40. Matrix Uncertainty reflects the extent to which test portion is not truly representative of the laboratory sample refers only to the effects of microbial distribution in a given matrix considered as independent of the analytical method used applies to all measurands on the same matrix/food item can be estimated if/when required (e.g., by customer)

  41. Matrix Uncertainty Approaches to estimate matrix uncertainty: A. Use of fixed value - for homogenous or well-mixed laboratory sample, a minimum fixed value can be used B. Repeatability experiments - analysing multiple test portions from laboratory samples to determine the within-sample variance C. Already known - relevant characteristics of the matrix well known and matrix uncertainty estimated from prior knowledge

  42. Matrix Uncertainty A. Homogeneous matrix or homogenised laboratory sample Experience indicates that liquids are regarded as being homogeneous and thus have a relatively low matrix uncertainty, typically umatrix = 0,1 log10 cfu/g or ml derived from 2003/2004 experiments reported in Ah Soon C. and Cornu M. Provided that the whole of the laboratory sample can be homogenised before taking the test portion, then the matrix uncertainty can be taken at a fixed value of umatrix = 0,1 log10. For more details on homogenisation refer to ISO 6887 series.

  43. Matrix Uncertainty B. Experiment - Multiple test portions from laboratory samples Matrix uncertainty may be estimated as the within-laboratory-sample repeatability standard deviation by analysing multiple test portions in repeatability conditions from one or more laboratory samples. Repeated measurements on a single laboratory sample are made under same conditions (i.e., same time, same operator, same equipment, same media batches, same equipment etc). Repeated measurements from multiple laboratory samples, may be analysed over a period of time to give a more generally applicable estimate of matrix uncertainty.

  44. Matrix Uncertainty Repeatability Experiment Repeat design for each laboratory sample do not homogenise do not artificially contaminate Matrix uncertainty is regarded as independent of target microorganism and test method used chose target microorganisms for which naturally contaminated samples are likely to be found (e.g. TVC)

  45. Matrix Uncertainty Repeatability Experiment take at least two test portions from each laboratory sample total number of test portions = at least 10 or more than the number of laboratory samples, i.e. 1 laboratory sample at least 11 results (all in same batch) 10 or more laboratory samples (from same matrix) at least 2 results each (replicates in same batch)

  46. Matrix Uncertainty Repeatability standard deviation transform cfu/g or cfu/ml results into log10 values calculate repeatability standard deviation sr : Single laboratory sample: calculate standard deviation Multiple laboratory samples: calculate standard deviation by one-way ANOVA (square root of within-groups mean square value) matrix standard uncertainty: umatrix = sr

  47. Matrix Uncertainty C. Already known The laboratory may be able to judge, from prior knowledge, the matrix uncertainty to be expected of a given laboratory sample. This may rely on previous analyses of multiple test portions from laboratory samples expected to have a similar matrix uncertainty (matrix homogeneity). When assessing whether laboratory samples can be expected to have a similar matrix uncertainty, the laboratory may consider examples of items for different categories and types provided in ISO 16140-3. Matrix uncertainty values obtained in one laboratory may be used by another laboratory for laboratory samples expected to have a similar matrix uncertainty.

  48. Matrix Uncertainty Repeatability standard deviation Note: Repeatability standard deviation will include any of the technical and distributional components relevant to the repeatability data, thus the combined uncertainty measurement of the test result will be an overestimate of uncertainty. As an option, lab can avoid this by subtracting any of the relevant distributional components from the experimental repeatability, if these are available.

  49. Practical approaches to estimate Measurement Uncertainty- Distributional Uncertainty

  50. Distributional Uncertainty irreducible minimum uncertainty components (assuming homogeneous material/perfect mixing) specific to individual measurement result depending on analytical method, there are three types Poisson uncertainty confirmation uncertainty Most Probable Number uncertainty the associated standard uncertainties can be calculated from look up tables (no practical work); ISO 19036 provides details on relevant look up tables

Related


More Related Content

giItT1WQy@!-/#giItT1WQy@!-/#giItT1WQy@!-/#giItT1WQy@!-/#giItT1WQy@!-/#giItT1WQy@!-/#giItT1WQy@!-/#