Implications of Raising Speed Limits to 75 mph and Beyond: Research Summary
This research project delves into the safety effects of increasing speed limits to 75 mph and higher, providing key findings from literature reviews, state assessments, and operational analyses. It aims to guide highway agencies in understanding the safety implications of elevated speed limits, examining historical events, state practices, enforcement policies, and crash trends related to increased speed limits.
Download Presentation

Please find below an Image/Link to download the presentation.
The content on the website is provided AS IS for your information and personal use only. It may not be sold, licensed, or shared on other websites without obtaining consent from the author.If you encounter any issues during the download, it is possible that the publisher has removed the file from their server.
You are allowed to download the files provided on this website for personal or commercial use, subject to the condition that they are used lawfully. All files are the property of their respective owners.
The content on the website is provided AS IS for your information and personal use only. It may not be sold, licensed, or shared on other websites without obtaining consent from the author.
E N D
Presentation Transcript
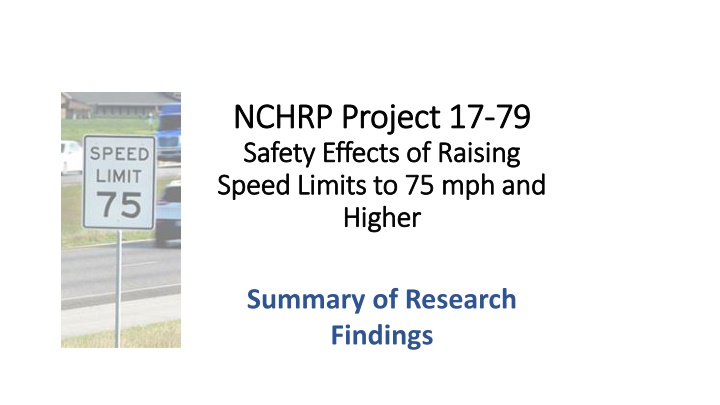
NCHRP NCHRP Project 17 Project 17- -79 Safety Effects of Raising Safety Effects of Raising Speed Limits to 75 mph and Speed Limits to 75 mph and Higher Higher 79 Summary of Research Findings
Summary of Content Research Objective Key Findings from Literature and State of Practice Roadside Treatment Suitability for Elevated Speed Limits Spillover Study Texas Safety Assessment Kansas Safety Assessment Transferability Assessment via Socioeconomic Analysis Kansas Safety Analysis Kansas Operating Speed Analysis Summary of Findings 2 2
Research Objective To provide guidance that can be used by highway agencies to better understand the expected safety implications of increasing speed limits to 75 mph or greater 3 3
Key Findings from Literature and State of Practice 4 4
Literature Review Historic Events National Maximum Speed Limit (1974-1987) Relaxation of Maximum Speed Limit (1987 1994) Repeal of National Maximum Speed Limit (1995 present) 5 5
State of Practice Implementation Questions Did your state consider specific functional classifications for elevated speed limits? If so, which ones? Many states limited implementation of higher speed limits to rural locations. Are elevated speed decisions made centrally, or are the districts empowered to set their own limits? Speed limit decisions were generally determined by a centralized DOT or a designated committee. Is there a documented or unofficial zero tolerance enforcement policy for elevated speed limits? Enforcement strategies vary by state and are generally left up to the enforcement agencies. 7 7
State of Practice Results Questions What are the prevailing 85th percentile speeds on corridors with elevated speed limits? Facilities with higher speed limits typically have higher speeds (increased speed limits have resulted in 85th percentile speeds increasing 3 to 5 mph). Have crashes become more serious? More frequent? Reports related to number of crashes varied with some states seeing an increase and other states maintaining similar crash frequencies. 8 8
State of Practice Wrap Up Questions How did the agency manage liabilities from roadside hardware tested only to 60 mph? States are aware of the new MASH roadside testing criteria but are waiting for direction at the national level before modifying barrier deployment. They noted that current barriers are performing well at the higher speeds. 9 9
State of Practice Final Recommendations Question: For states with recent increases in speed limit, what recommendations would you share with other states who are considering increasing the speed limit? Answers: Acquire significant before data Consider heavy vehicle speeds and how they work with the passenger car speeds Work with the state legislature Understand associated costs (short and long term) Consider impacts to entire roadway network Talk to other states that have implemented higher speed limits to find out issues to expect 10 10
Roadside Treatment Suitability for Elevated Speed Limits Assembled merged data set [NCHRP Project 17-43 and National Automotive Sampling System Crashworthiness Data System (NASS- CDS)] Identified key assessment features: Speed limit and relationship to roadside objects struck Impact speed Impact angle Object angle See next slide for example findings. 12
Roadside Hardware Suitability Findings Descriptive statistics suggest a higher impact speed and impact angle may be needed for speed limits of 70 mph or greater For roads with speed limits of 70 and 75 mph, weighted 85th percentile impact speed and angle are 67.7 mph and 33 degrees, respectively. (These are considerably different from current conditions of 62.2 mph and 25 degrees orientation angle.) Recommendation: Evaluate the higher impact speed and angle to overcome sample limitations that may be present. 13
Spillover Study Increased speed limits on freeways are often thought to result in higher speeds and potentially more crashes on surface streets located near the access to freeways. In the context of this study, this is referred to as a spillover study. 14
Spillover Study (continued) Crashes with speed as a contributing factor begin to dissipate within approximately two miles of the freeway. At 10,000 feet the differences due to speed tend to converge. 15
Texas Safety Assessment In recent years, Texas DOT increased speed limits to 75 mph or higher for select high-speed roads. This analysis included an assessment of influence on safety due to the increased speed limit using the following two study types: Before-After Statistical Analysis Cross-sectional Analysis 16
Texas Safety Assessment (Before-After) Crash Type Freeway* Comments Descriptive Analysis (Before-After) General observed increase in crashes for 75 and 80 mph Statistical Analysis (Before-After) 11% (Significant) 14% (Significant) Based on inspection of data Total rural crashes Total rural freeway crashes KAB rural freeway crashes Nighttime rural freeway crashes Fixed object rural freeway crashes Overturn rural freeway crashes Based on change in speed limit from 70 to 75 mph only 23% (Significant) 27% (Significant) 39% (Significant) *Texas before-after analysis only available for freeways. KAB refers to fatal and severe crashes. 17
Texas Safety Assessment (Cross Section) Rural Multi- Lane Divided Rural Multi- Lane Undivided Crash Type Freeway Rural Two-Lane Comments 10% (Not significant) M1 7% (Not significant) M2 7% (Not significant) M1 5% (Not significant) M2 8% (Not significant) 23% (Not significant) M1 19% (Not significant) M2 Total rural crashes (75 mph PSL) -15 % (Significant) 1% (Not significant) -15 % (Significant) KAB rural crashes (75 mph PSL) -4 % (Not significant) 2% (Not significant) Compared to base condition of 70 mph -10 % (Significant) Total rural crashes (80 mph PSL) NA NA NA KAB rural crashes (80 mph PSL) NA NA NA NA = Not applicable or not available, PSL = Posted speed limit = Decrease in crashes. = Increase in crashes M1 = Model 1, M2 = Model 2 18
Kansas Safety Assessment Conducted before-after analysis for rural freeways Posted speed limits at all sites were increased from 70 to 75 mph on July 1, 2011 Analysis included single-vehicle crashes and two-vehicle crashes Included findings from an Empirical Bayes before-after analysis conducted previously by a Kansas researcher (Shirazinejad) using same data source 19
Kansas Safety Assessment Study by Shirazinejad (2018) used EB before-after and determined an increase in total rural freeway crashes of 16% but no significant increase for KAB rural freeway crashes. When study method was enhanced to include comparison group and to consider a fixed-parameters negative binomial approach, both total rural and KAB rural freeway crashes increased significantly. Before-after comparison for the NCHRP Project 17-79 determined that (1) no evidence that speed limit change statistically changed total rural crashes, and (2) single vehicle rollover crashes produced higher probabilities of severe injury. 20
Transferability Assessment via Socioeconomic Analysis To determine if findings from Kansas could be transferred to other states, the project team conducted a socioeconomic comparison to Iowa (a state with very similar socioeconomic traits. The Team used time series analysis to identify the most influential factors affecting rural freeways. These were: Total vehicle miles traveled Posted speed limit Population in age groups 21-25, 26-30, and 41-50 Gross domestic product of agriculture, construction, durable goods, health, and transportation Personal income and employment 21
Transferability Assessment via Socioeconomic Analysis (continued) Team used Dynamic Regression Model Estimates to evaluate transferability between Kansas and Iowa socioeconomic analysis and found these models were a relatively adequate fit for the rural freeway crash comparison for the two states. Findings indicated that the number of rural freeway crashes were similar for Kansas and Iowa following change in maximum speed limit for Kansas (no change in Iowa maximum speed limit). Kansas experienced a decrease followed by an increase in crashes following their maximum speed limit change. Iowa experienced a similar trend. Overall Kansas factors that influenced rural freeway crashes included vehicle miles traveled and posted speed limit. Iowa factors did not include the posted speed limit as a significant factor. 22
Operating Speed Associated with Rural Freeway Maximum Speed Limit Changes from 70 to 75 mph Data used for this analysis was acquired using Kansas speed monitoring stations. Before-after speed sensor data for five speed station locations included for before study periods (2010 before dates for one week at each sensor) and after study periods (2012 and 2014 after dates for one week each. The weeks were matched across time for each site. 23
Operating Speed Associated with Rural Kansas Freeway Maximum Speed Limit Changes from 70 to 75 mph - Findings The before operating speed (where PSL = 70) was significantly different than the after operating speed (where PSL = 75). Seven-day week: Rightmost lane statistically significant increase in average operating speed of 1.8 to 2.1 mph. Other lanes (not rightmost) was statistically significant increase of 2.5 to 1.7 mph for the seven-day week. 24
Operating Speed Associated with Rural Kansas Freeway Maximum Speed Limit Changes from 70 to 75 mph - Findings Increase in Average Operating Speed Rightmost freeway lane 7-day week 1.8 to 2.1 mph Weekday 2.1 mph Weekend 2.1 mph Study period of interest Other freeway lanes 2.5 to 2.7 mph 2.6 mph 3.0 mph 25
Overview of Findings Roadside Hardware (previously tested for lower speeds) should be re- evaluated for higher speeds. Crash spillover on surface arterial roads near freeways tends to lose sensitivity to freeway speed at a point that is approximately 10,000 feet from the freeway. Safety studies for Kansas and Texas indicate that crashes generally increase with an increase in the maximum posted speed limit; however, these increases are not always statistically significant. In Kansas, the increased maximum speed limit from 70 mph to 75 mph resulted in a change in average operating speed from 1.8 mph to 3.0 mph. These values vary slightly based on study duration (day of week, weekend, or seven-day week) and lane configuration (rightmost freeway lane versus other freeway lanes). 26
This presentation was developed by Texas A&M Transportation Institute and Leidos under NCHRP Project 17-79. More information about this topic can be found in NCHRP Research Report 1006: Guide for Understanding Effects of Raising Speed Limits and NCHRP Web-Only Document 328: Safety Effects of Raising Speed Limits to 75 mph and Higher, available on the National Academies Press website (www.nap.edu). NCHRP is sponsored by the individual state departments of transportation of the American Association of State Highway and Transportation Officials. NCHRP is administered by the Transportation Research Board (TRB), part of the National Academies of Sciences, Engineering, and Medicine, under a cooperative agreement with the Federal Highway Administration (FHWA). Any opinions and conclusions expressed or implied in resulting research products are those of the individuals and organizations who performed the research and are not necessarily those of TRB; the National Academies of Sciences, Engineering, and Medicine; FHWA; or NCHRP sponsors. 27
